Trend Projection
1. Introduction
1. Rationale
"History will repeat itself" is one of the three assumptions in the field of technical analysis. The trend of a stock is often replicable. This feature is intended to improve users' efficiency in analyzing candlestick charts, help them find stocks with a candlestick chart similar to that of the target stock in a faster manner, and thus predict the possible future trend of the target stock.
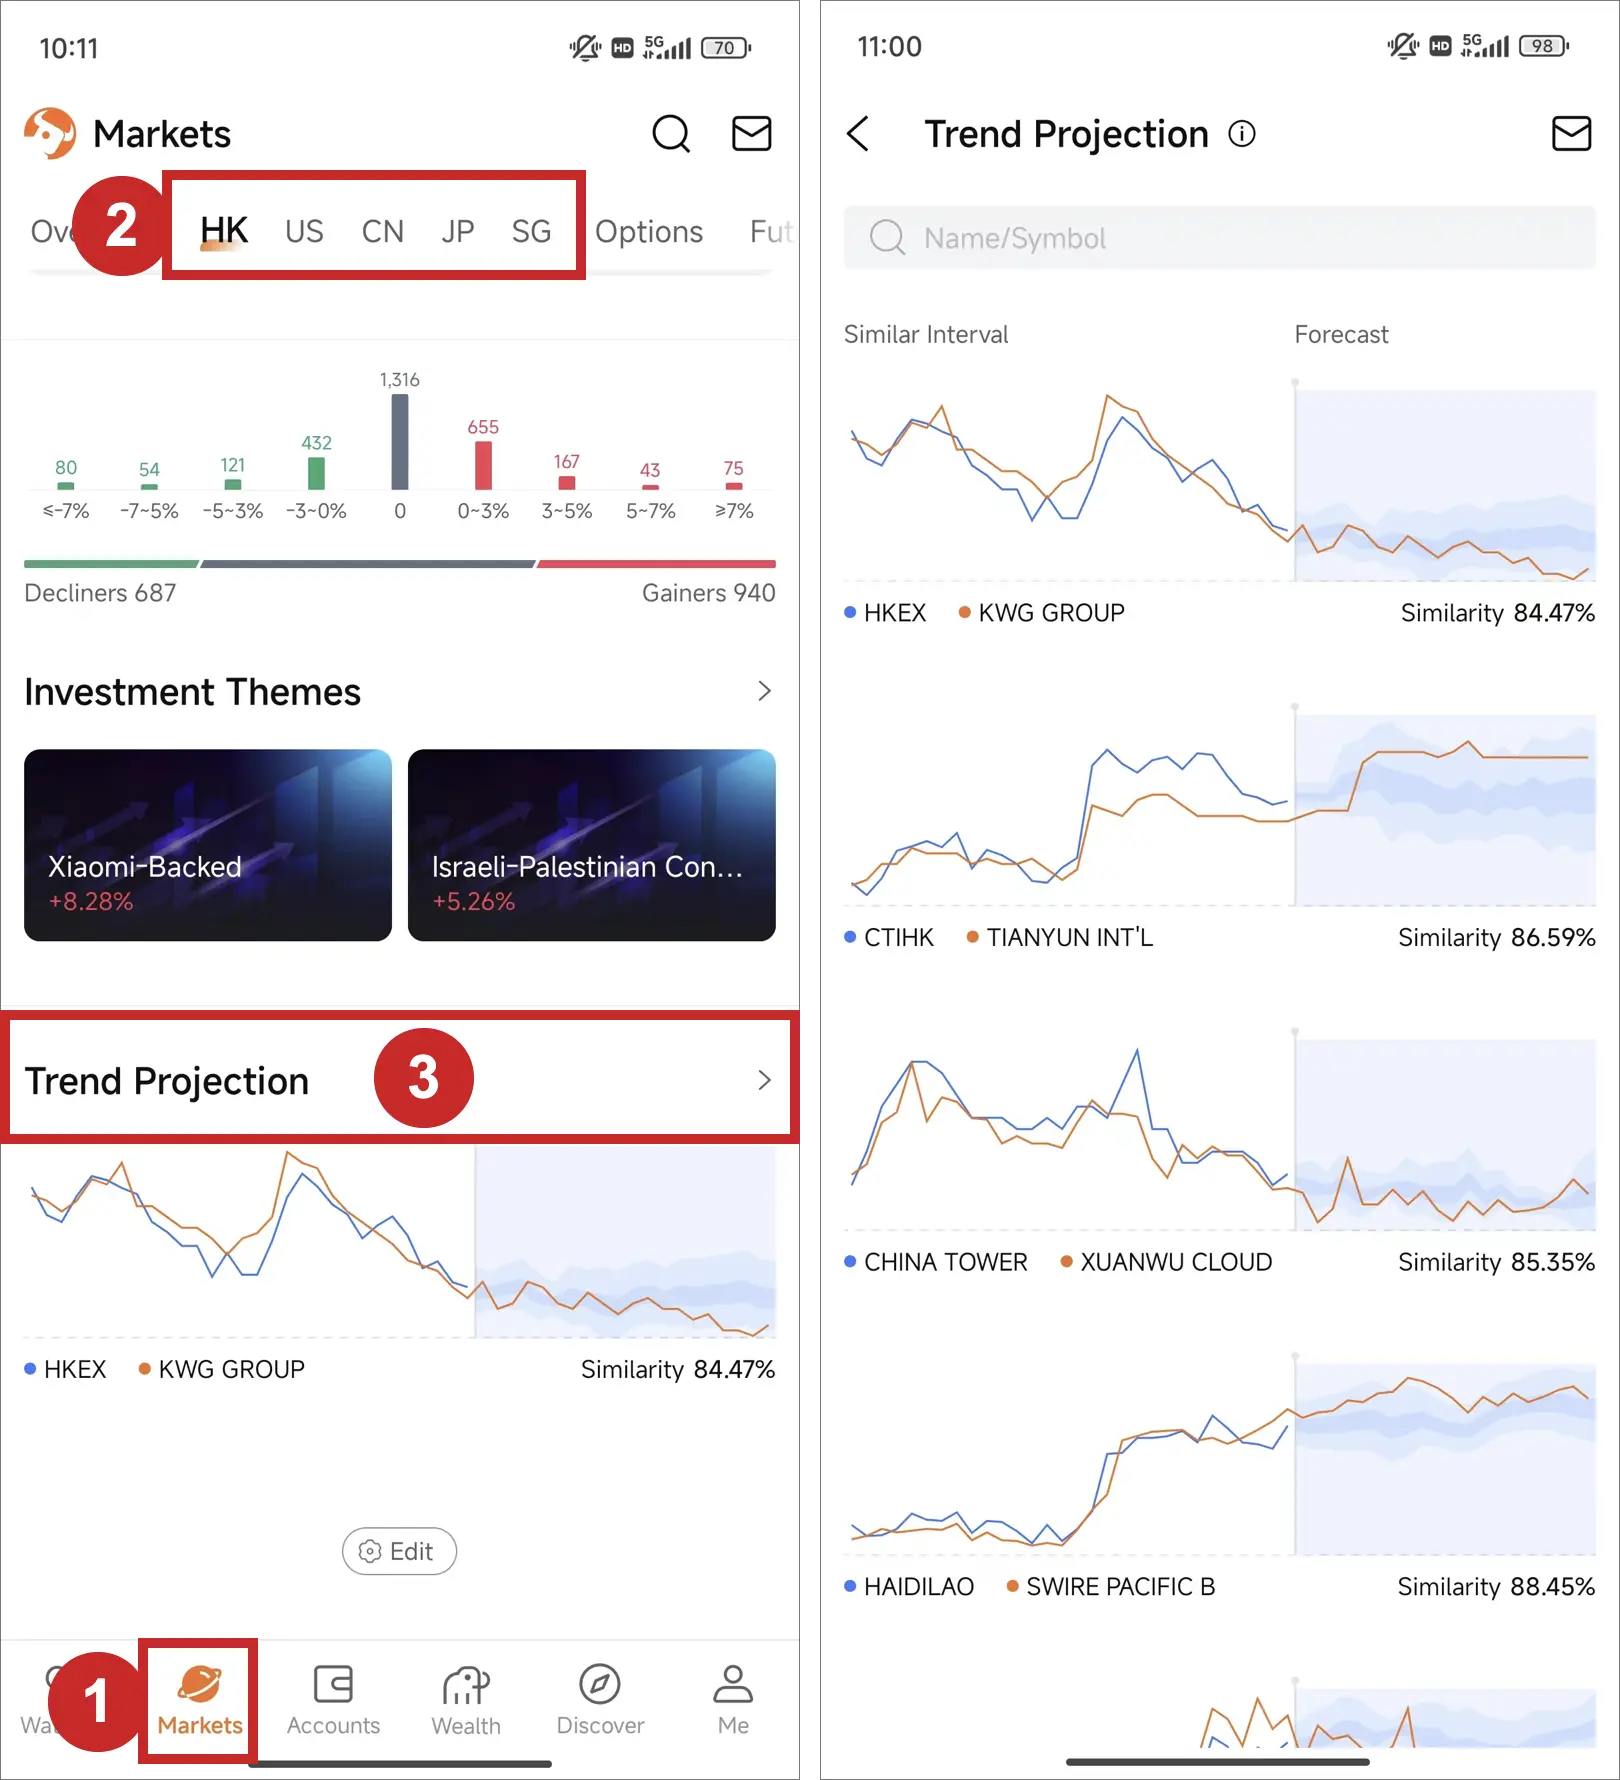
2. Home Page
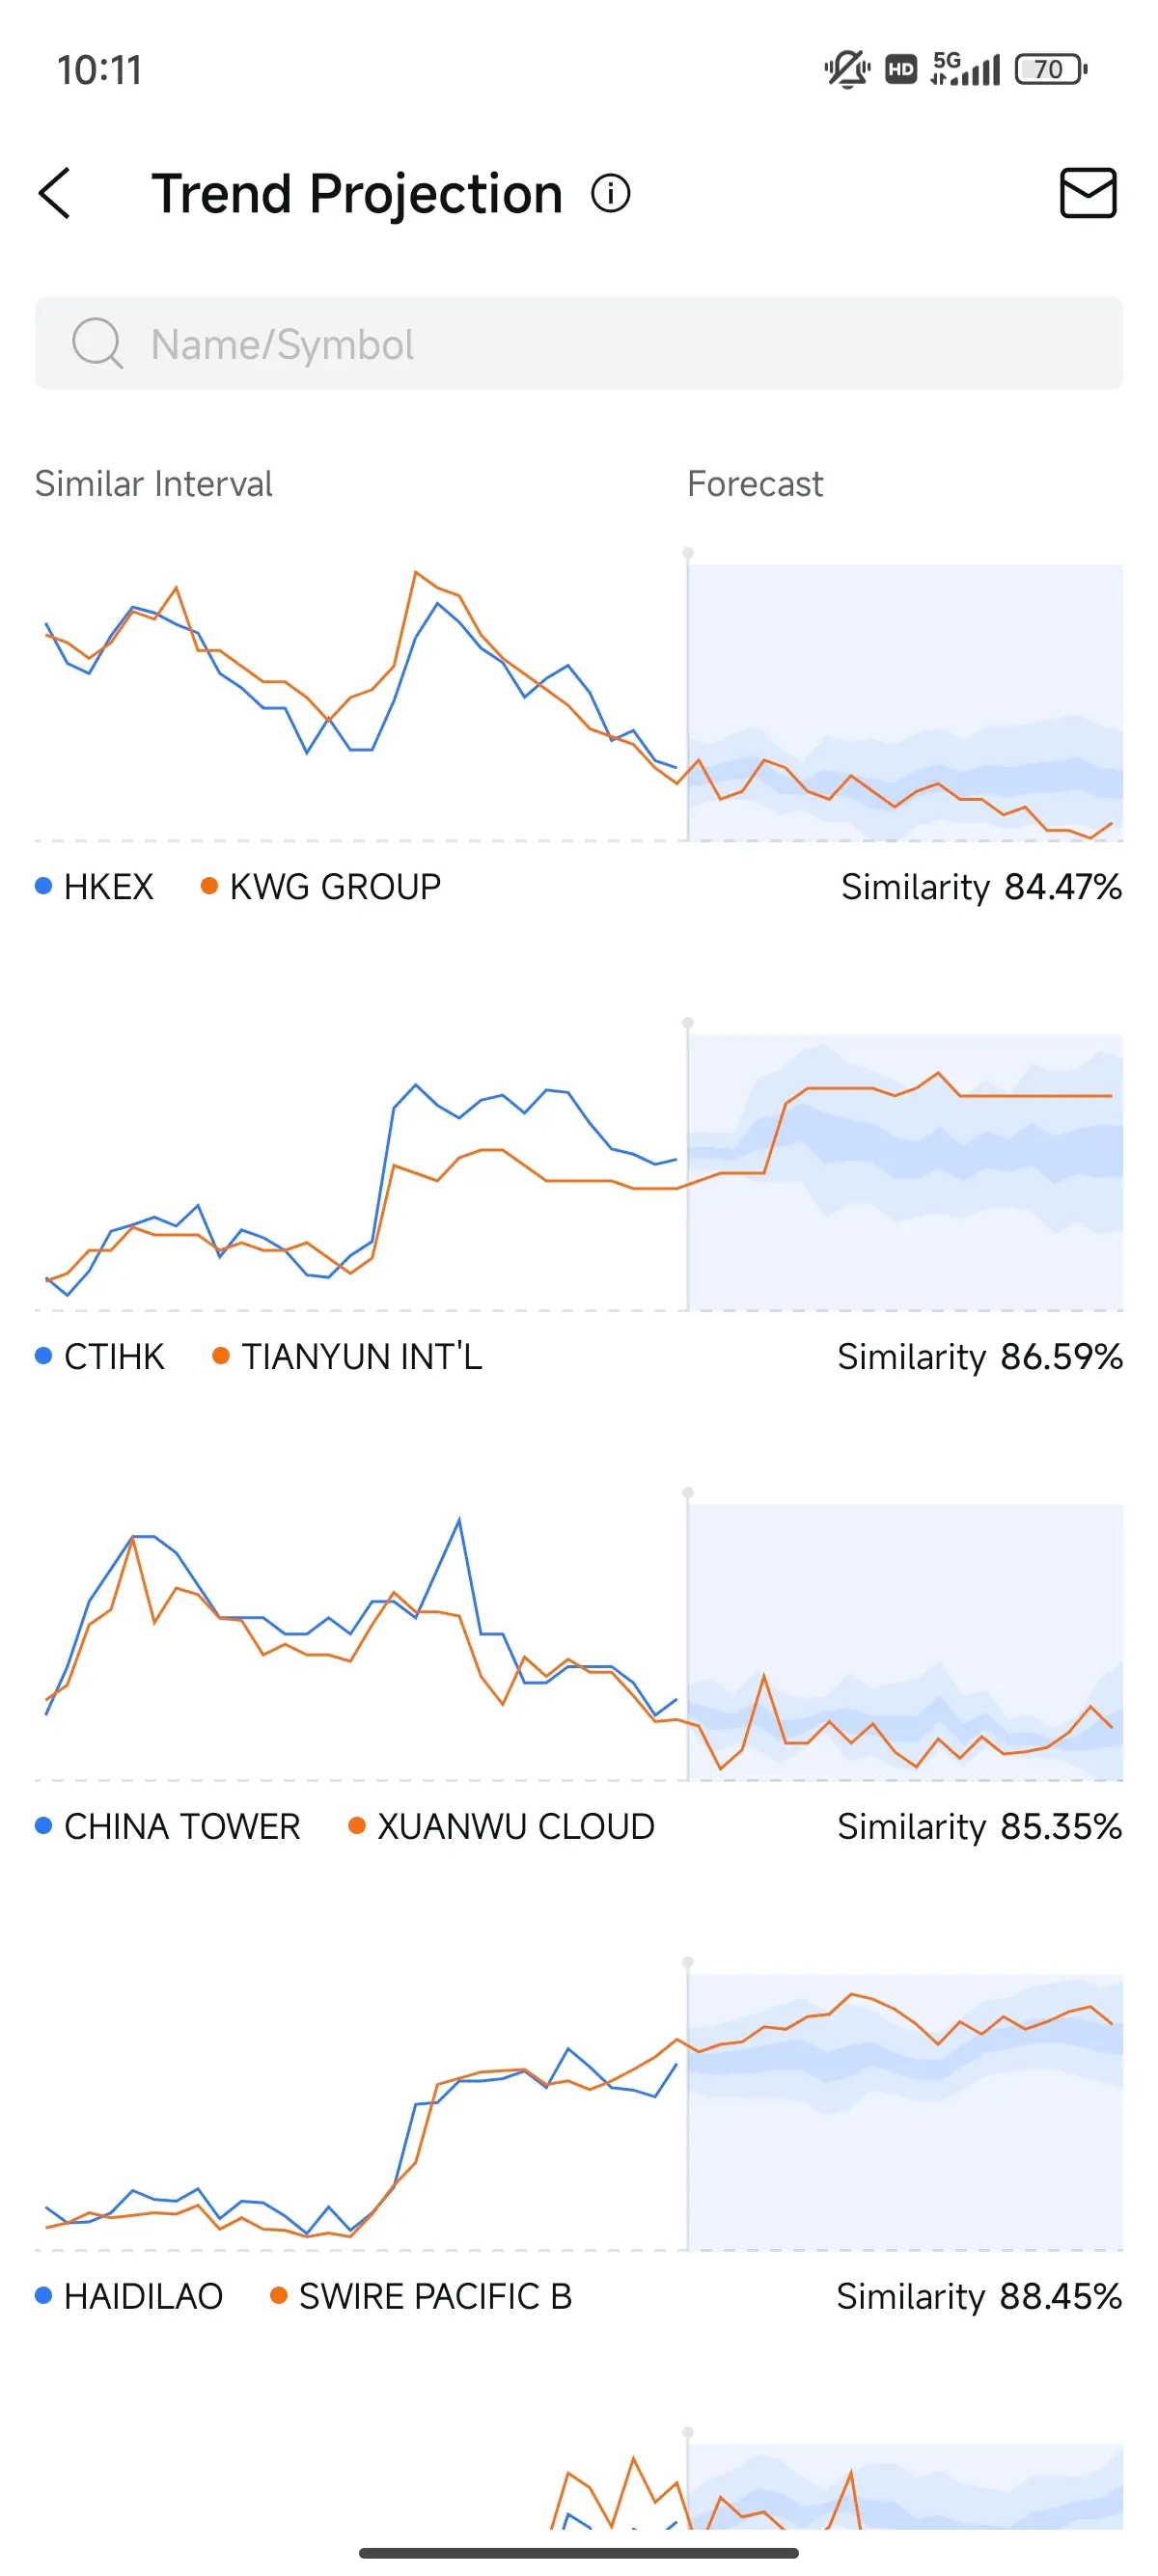
You can search for a target company name or stock symbol at the top of the home page.
Under the Trending tab and the Watchlist tab are candlestick charts of hot stocks and stocks you are following, respectively, and their respective similar candlestick chart, as well as the similarity.
In particular, the similarity is calculated by identifying and analyzing the patterns and trends reflected in two candlestick charts and then using a specific algorithm.
|
Page |
Markets |
Quotation |
|
Diagram |
|
|
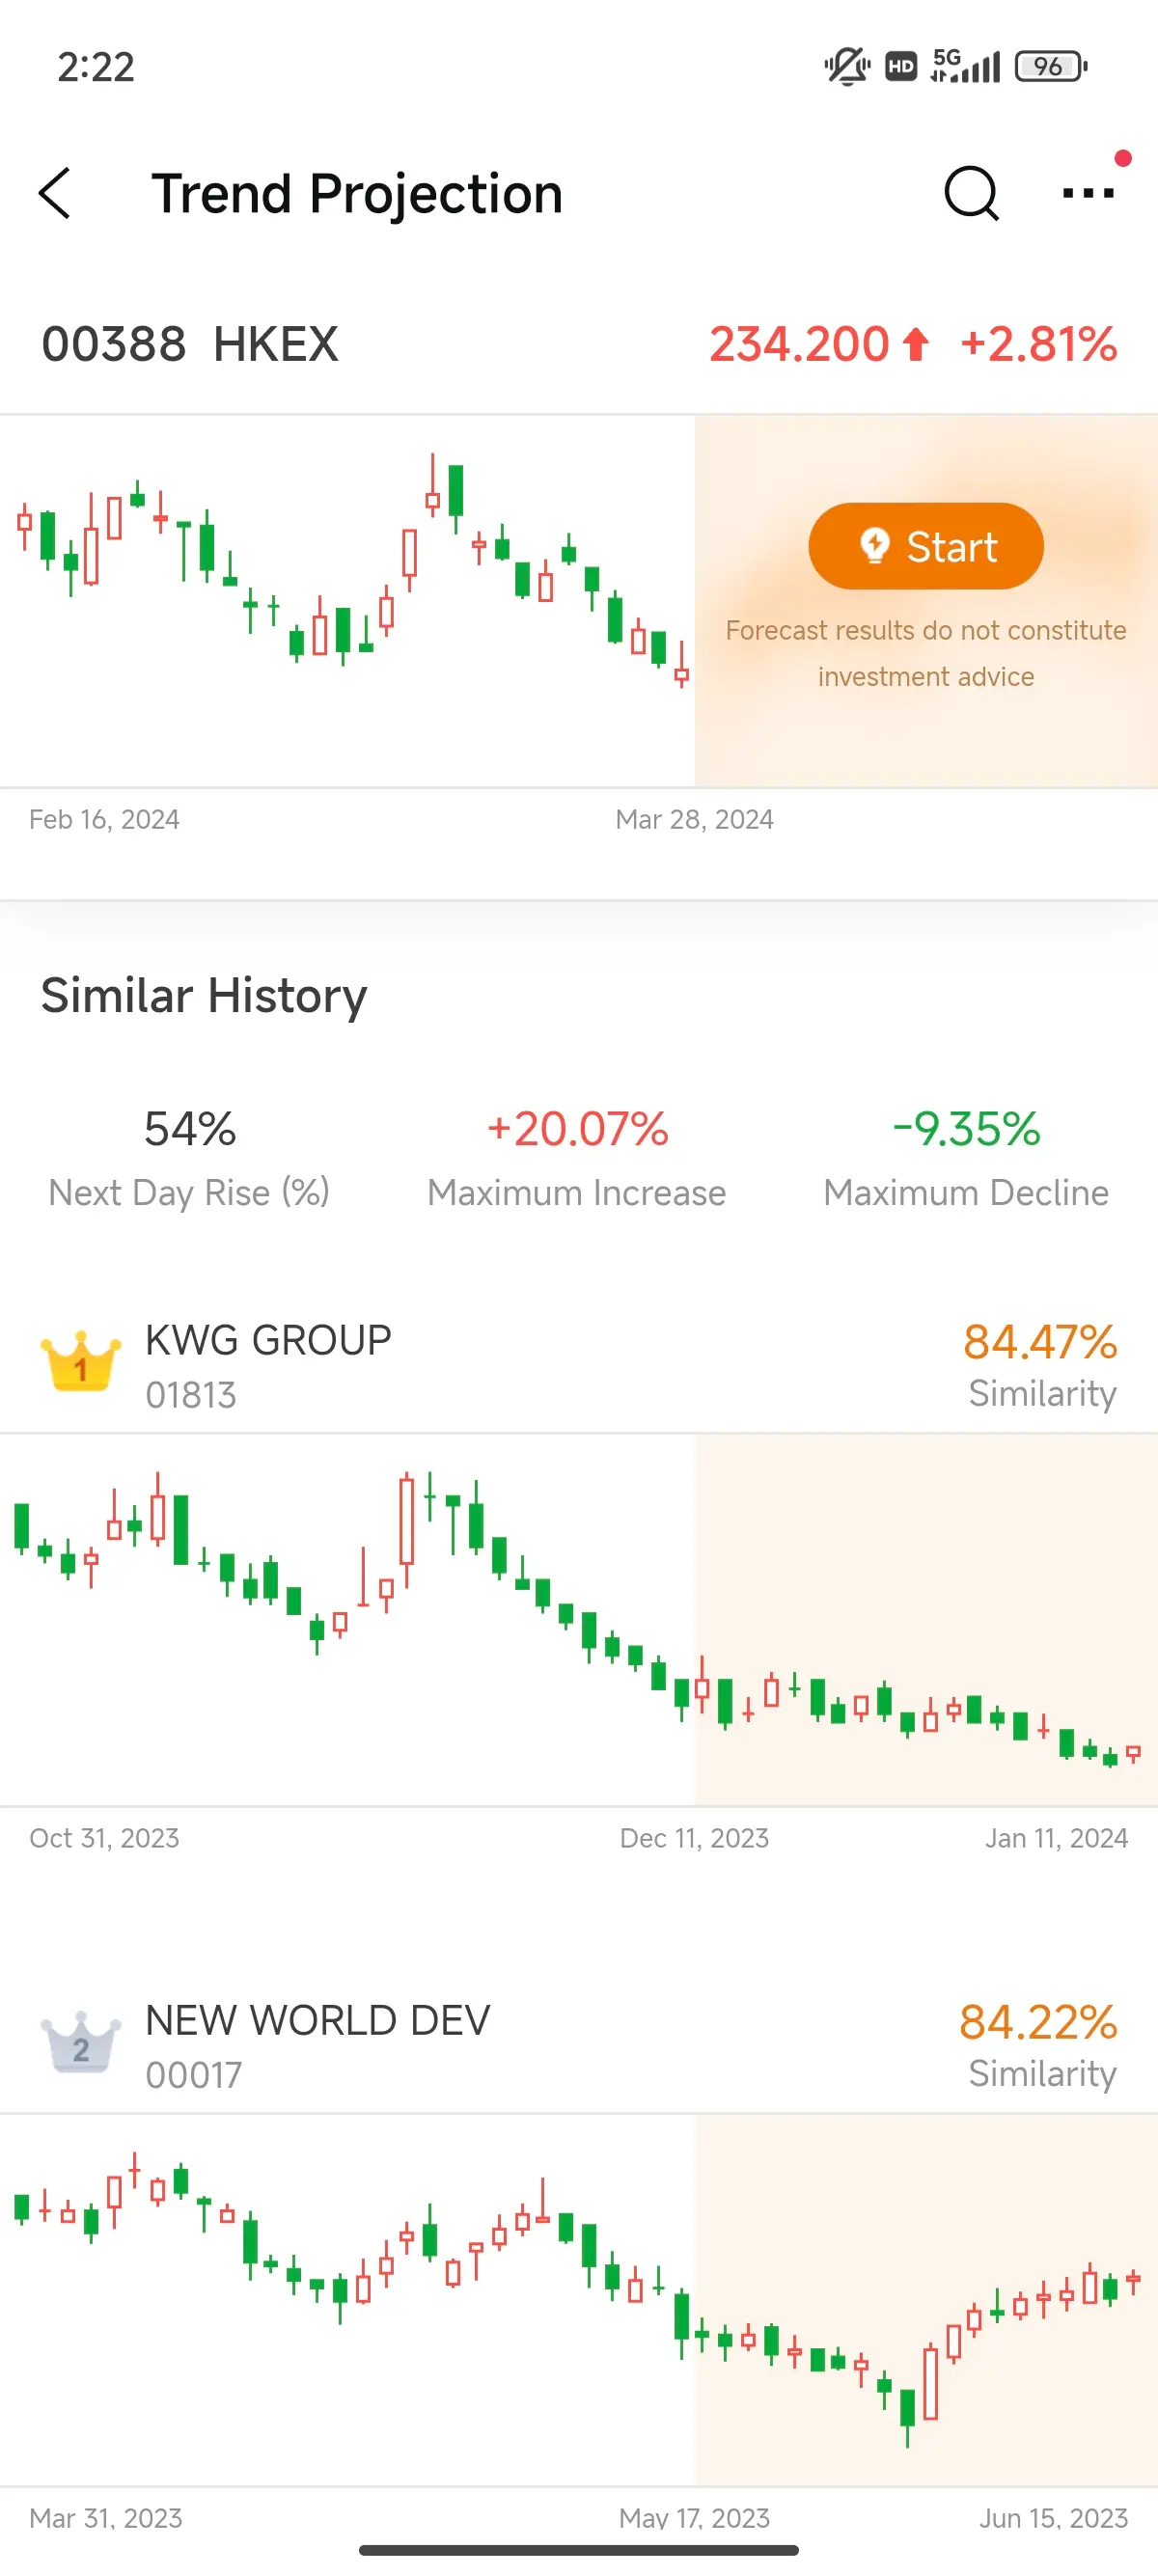
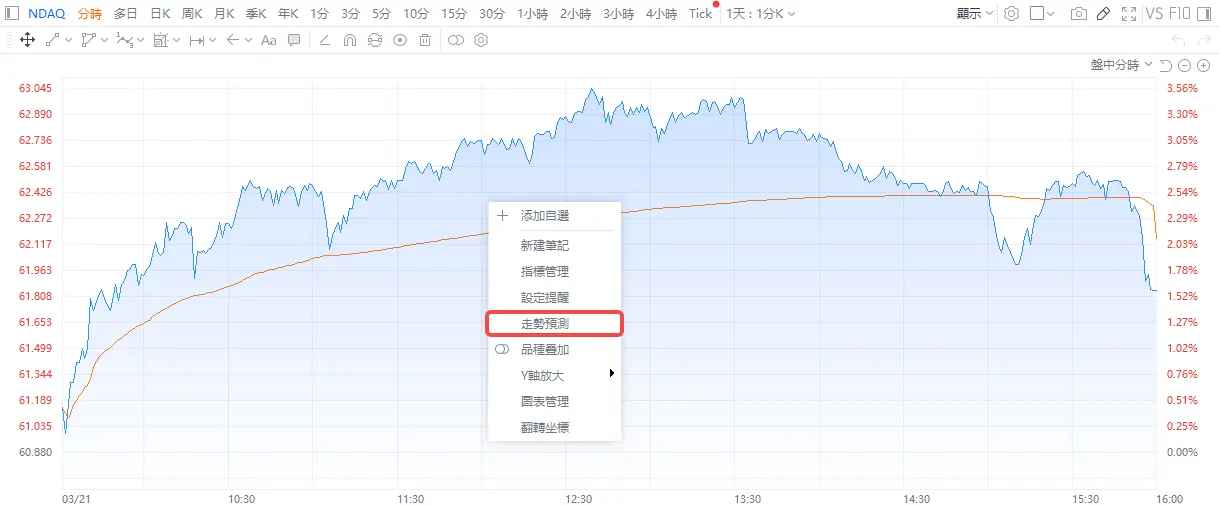
You can forecast the future trend of the target stock on this page. The forecast is derived by calculating the similarity between the current trend of the target stock and the historical trends of other stocks with similar candlestick charts and then obtaining the probability distribution of the future trends of the target stock.
All data and information are for investors' reference only and do not constitute any investment advice.
2. Navigation
1. Quotation
Mobile
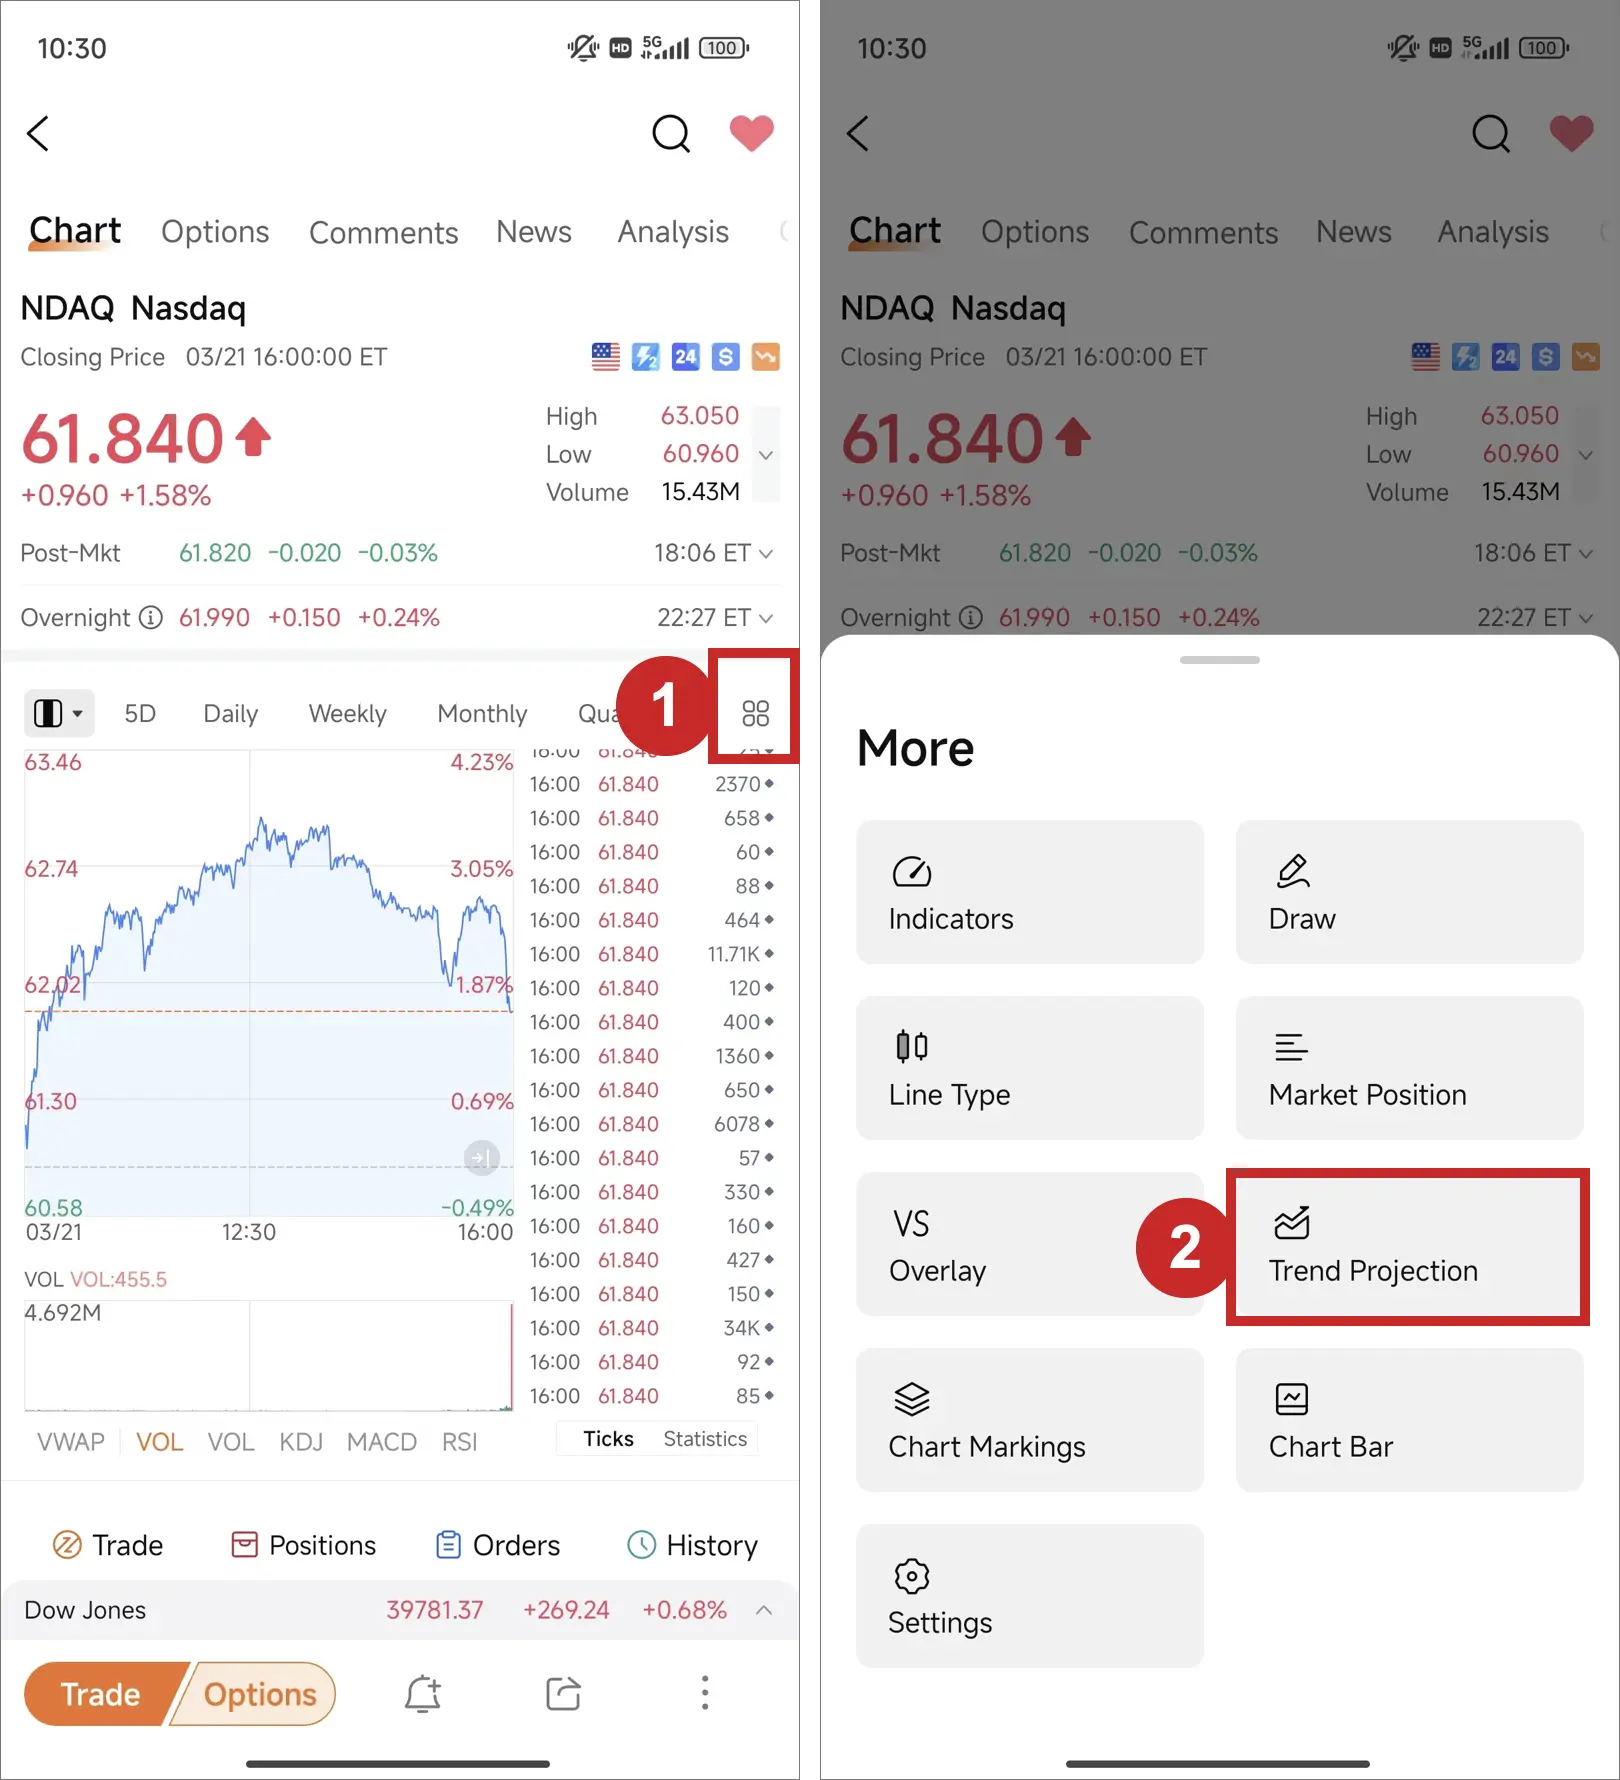
Desktop
2. Markets
Mobile only