Market Monitor
1. What is Market Monitor?
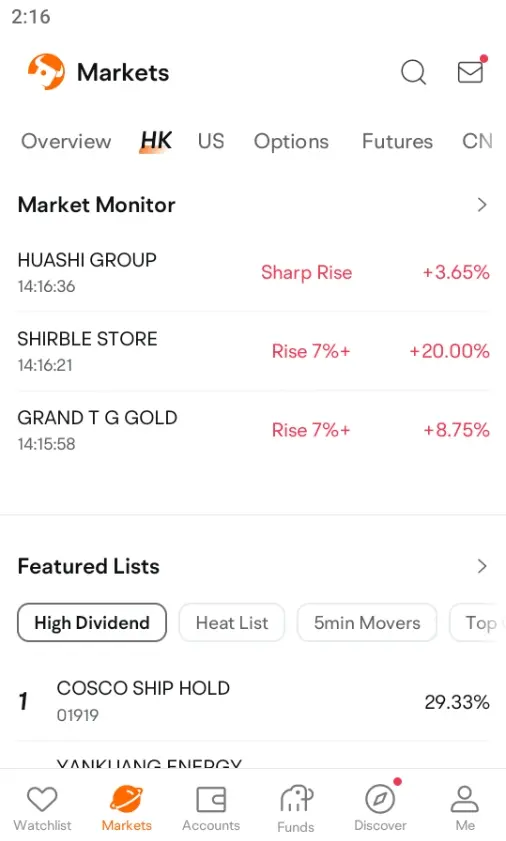
Market Monitor helps users track the unusual activities of all stocks in the markets in real time. It keeps investors posted on the market movements and saves the trouble of manually setting certain conditions beforehand.
1.1 Where to Find the Feature
● App: Markets > HK/US > Market Monitor
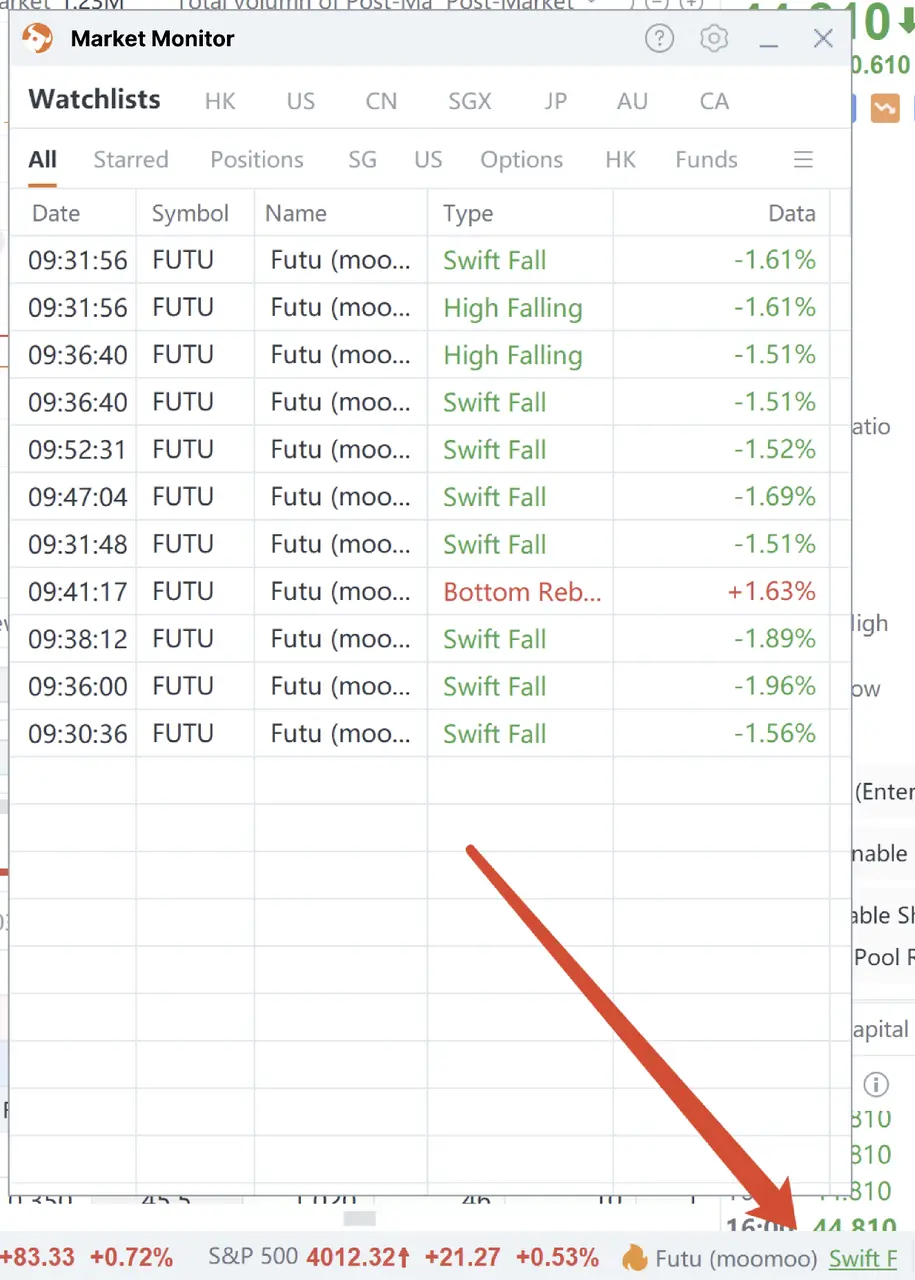
● PC: Market Monitor can be found on the bottom right corner of the desktop interface
1.2 Market Monitor Coverage
Market Monitor covers all stocks in US, HK, CN, SG, JP, AU, and CA markets, and all stocks in your watchlists.
2. How to Set Up Market Monitor on App
There are two ways to go to Market Monitor Settings.
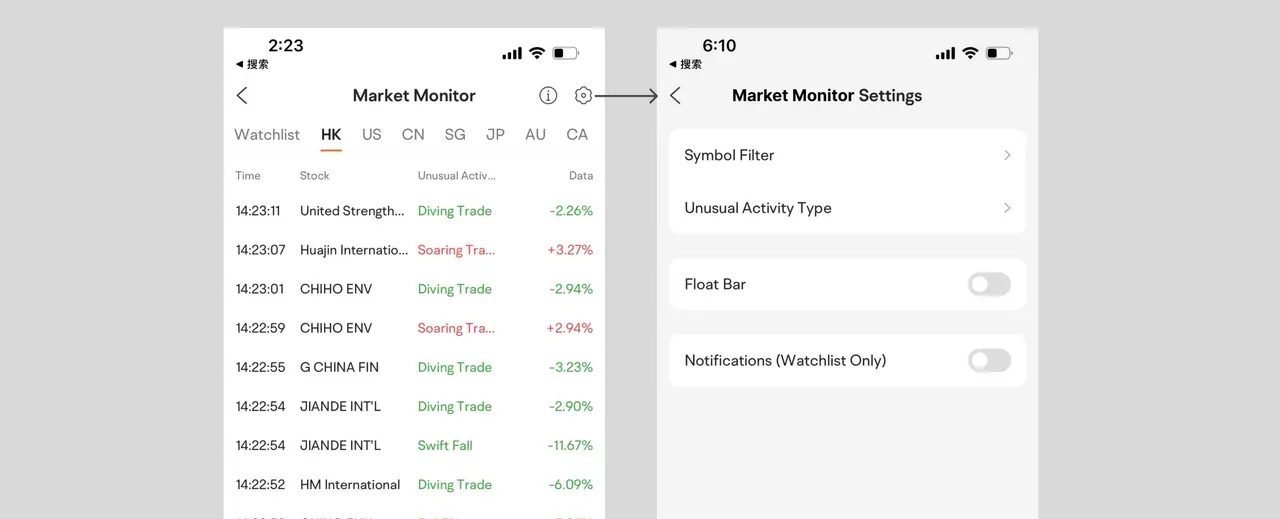
● Markets > Market Monitor > Settings icon > Market Monitor Settings
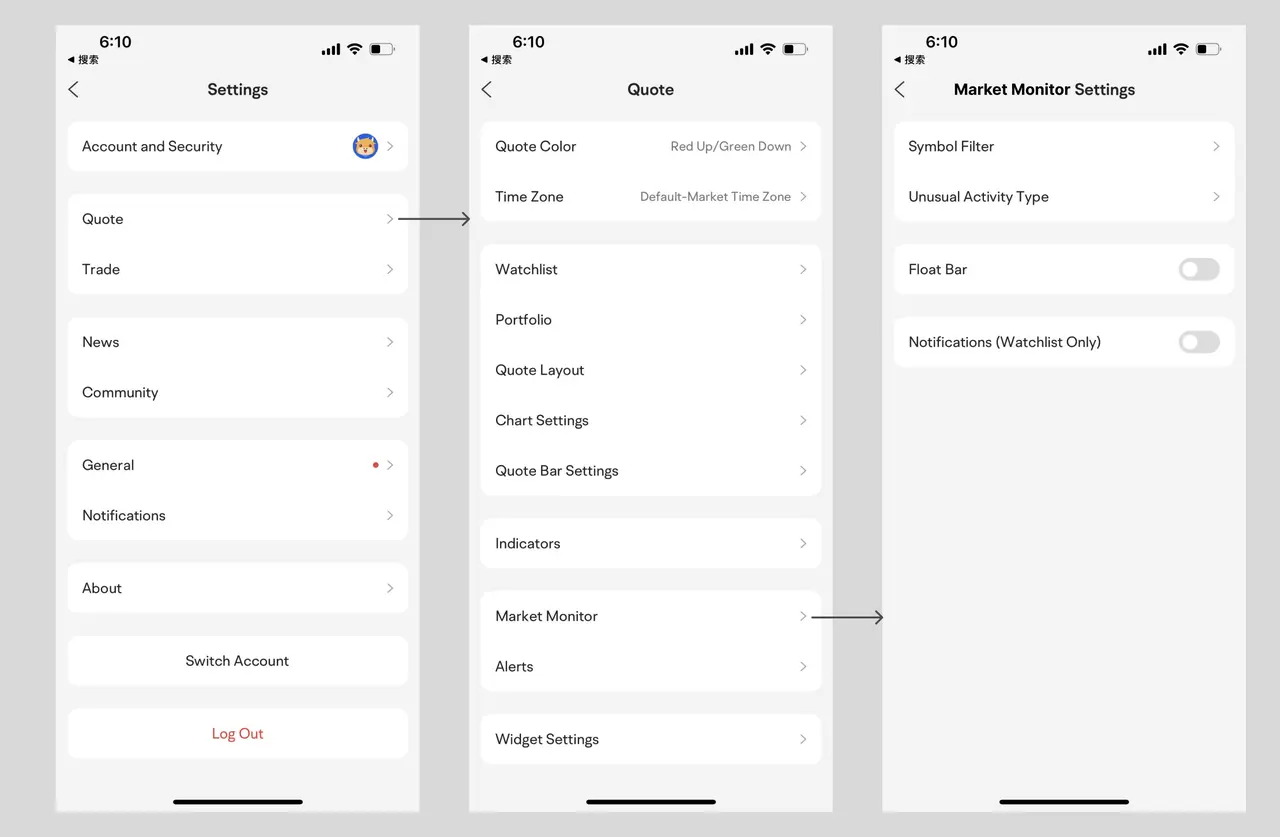
 ● Me > Settings > Quote > Market Monitor > Market Monitor Settings
 2.1 Symbol Filter
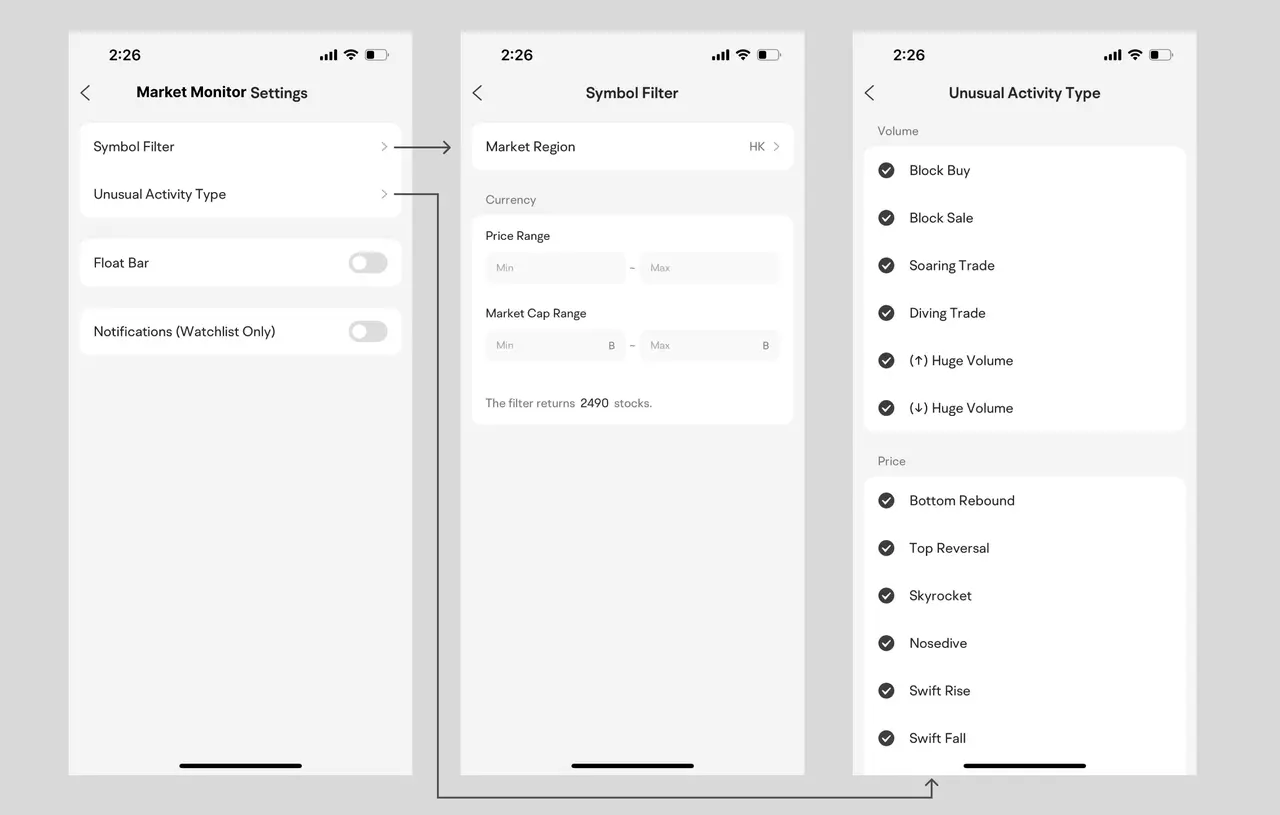
You can use Symbol Filter to narrow down the stocks that meet your filtering criteria.
● Market Region: monitor stocks in a specific market
● Price Range: monitor stocks within a specific price range
● Market Cap Range: monitor stocks within a specific market cap range
2.2 Unusual Activity Type
You can select unusual activity types you wish to monitor by checking the boxes.
3. Unusual Activity Types & Indicators
Stocks' unusual activities are denoted by unusual trading volume and unusual prices.
● Unusual Trading Volume: calculated by a stock's volume and turnover
● Unusual Price: calculated by a stock's price change and ticker data
Detailed Description:
| Unusual Activity Type | Indicators | Description |
| Unusual Trading Volume | Block Buy | 1. At least 800 transactions were concluded in the past 60 minutes. 2. The turnover of a single buy-side transaction is greater than the average turnover of all transactions in the past 60 minutes. |
| Block Sale | 1. At least 800 transactions were concluded in the past 60 minutes. 2. The turnover of a single sell-side transaction is greater than the average turnover of all transactions in the past 60 minutes. | |
| Soaring Trade | 1. The volume continues to increase in 3 minutes. 2. A single buy-side transaction at a high price enters the market, and the absolute value of the price increase over the last transaction is greater than 2% of the previous close. | |
| Diving Trade | 1. The volume continues to increase in 3 minutes. 2. A single sell-side transaction at a high price enters the market, and the absolute value of the price fall over the last transaction is greater than 2% of the previous close. | |
| (↑) Huge Volume | 1. The volume continues to increase in 15 minutes. 2. The trading volume per minute in 3 minutes is greater than or equal to 3 times the average trading volume. 3. The average trading volume in 3 minutes is greater than or equal to 6 times the average trading volume. 4. The price change in 3 minutes is greater than 0. | |
| (↓) Huge Volume | 1. The volume continues to increase in 15 minutes. 2. The trading volume per minute in 3 minutes is greater than or equal to 3 times the average trading volume. 3. The average trading volume in 3 minutes is greater than or equal to 6 times the average trading volume. 4. The price change in 3 minutes is less than 0. | |
| Unusual Price | Bottom Rebound | 1. The volume increases every minute in a span of 15 minutes. 2. The price fall 5 minutes ago is less than or equal to 1.5%. 3. The price increase 1 minute ago is greater than or equal to 0.8%.4. The price increase in 5 minutes is greater than or equal to 1.5%. |
| Top Reversal | 1. The volume increases every minute in a span of 15 minutes. 2. The price increase 5 minutes ago is greater than or equal to 1.5%. 3. The price increase 1 minute ago is less than or equal to +0.8%. 4. The price increase in 5 minutes is less than or equal to +1.5%. | |
| Skyrocket | 1. The volume increases every minute in a span of 15 minutes. 2. The total price increase is greater than or equal to 2% in 5 minutes, and the amplitude 10 minutes ago is less than or equal to 1.2%. | |
| Nosedive | 1. The volume increases every minute in a span of 15 minutes. 2. The total price fall is less than or equal to 2% in 5 minutes, and the amplitude 10 minutes ago is less than or equal to 1.2%. | |
| Swift Rise | 1. The volume increases every minute in a span of 5 minutes. 2. The price increase in 1 minute is greater than or equal to 0.8%, and the total price increase in 5 minutes is greater than or equal to 1.5%. | |
| Swift Fall | 1. The volume increases every minute in a span of 5 minutes. 2. The price fall in 1 minute is less than or equal to 0.8%, and the total price fall in 5 minutes is less than or equal to 1.5%. |
4. Stats
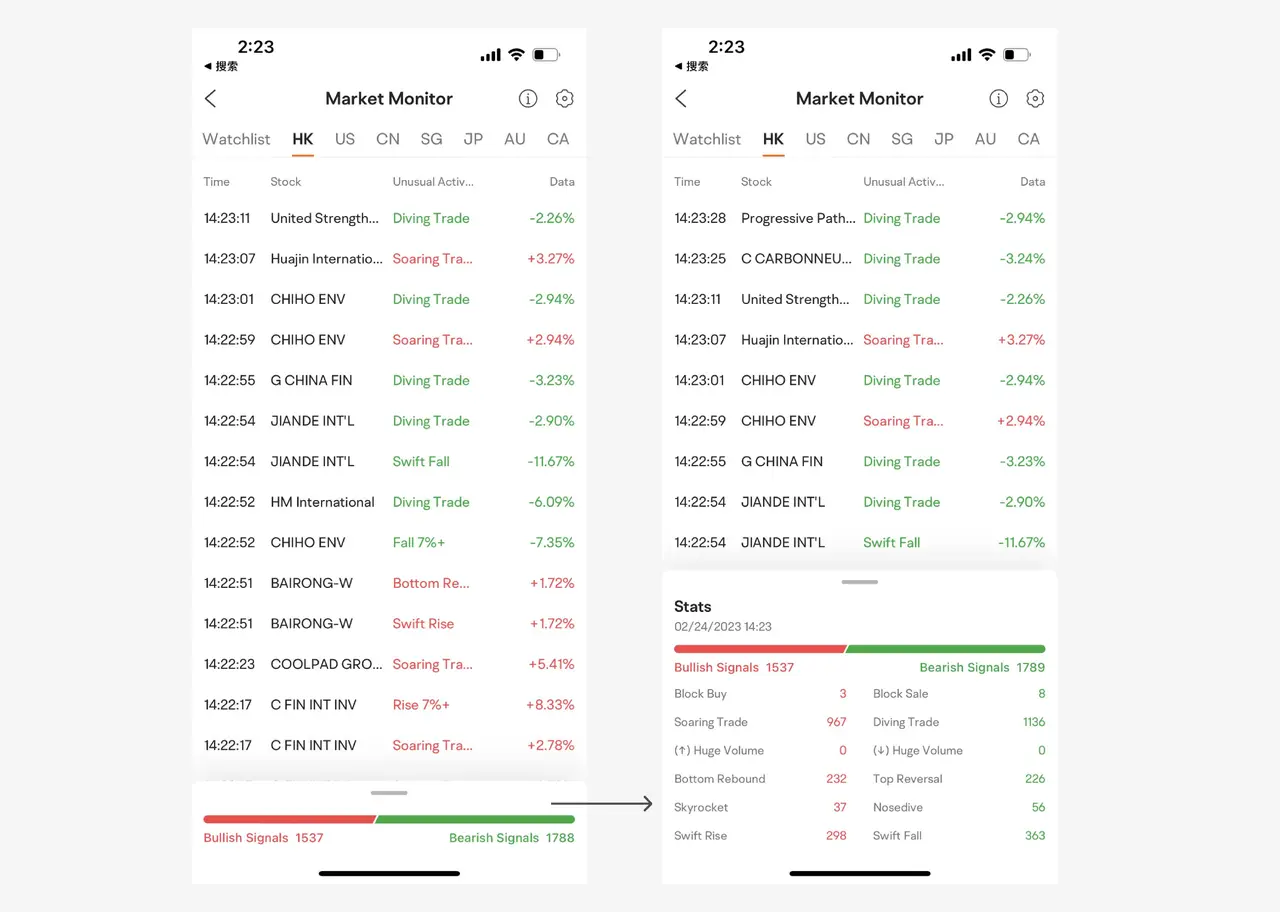 Here Bullish Signals and Bearish Signals are calculated on the weighted data of trading volume and price across the market. With the help of Stats, you may make more informed investment decisions.
5. Float Bar
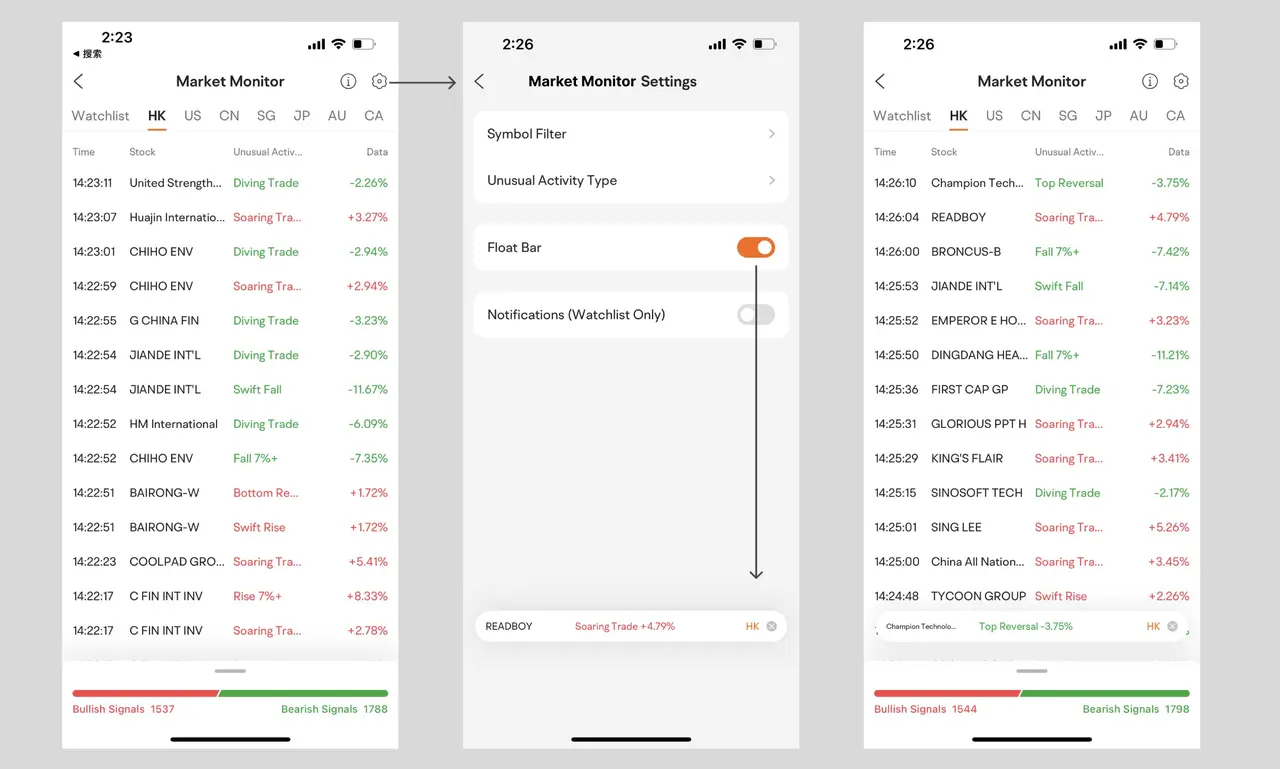
● If you turn on the float bar, the unusual activities in the selected market/watchlist/sector/index will be displayed.
E.g., If you switch to the "Watchlists" tab and turn on the float bar, the unusual activities of the stocks in your watchlists will be monitored.
● The float bar shows the latest unusual activity data and the current coverage of the Market Monitor.
● Tap and hold the float bar to drag it up or down.
6. Disclaimer
No content herein shall be considered an offer, solicitation, or recommendation for the purchase or sale of securities, futures, funds, or other investment products. It does not take into account your investment objectives, financial situation, or particular needs. All information and data, if any, are for reference only, and past performance should not be viewed as an indicator of future results. It is not a guarantee for future results. Investments in stocks, options, ETFs, funds, and other instruments are subject to risks, including possible loss of the amount invested. The value of investments may fluctuate, and as a result, clients may lose the value of their investment. Please consult your financial adviser as to the suitability of any investment.
Overview
- 1. What is Market Monitor?
- 1.1 Where to Find the Feature
- 1.2 Market Monitor Coverage
- 2. How to Set Up Market Monitor on App
- Settings > Quote > Market Monitor > Market Monitor Settings"},"attribs":{"0":"*0*1+2*0+2*0*1+a*0+1*0*1+7*0+1*0*1+15"}},"apool":{"numToAttrib":{"0":["author","7143489693835853827"],"1":["bold","true"]},"nextNum":2}},"type":"bullet","referenceRecordMap":{},"extra":{"mention_page_title":{},"external_mention_url":{}},"isKeepQuoteContainer":false,"isFromCode":false,"selection":[{"id":131,"type":"text","selection":{"start":0,"end":64},"recordId":"UYOOdWo4CowimExOUllcL88AnMf"}],"isCut":false}" data-lark-record-format="docx/text">2.1SymbolFilter
- 2.2 Unusual Activity Type
- 3. Unusual Activity Types & Indicators
- 4. Stats
- 5. Float Bar
- 6. Disclaimer