Interpretation of indicators
1. Entry
Details Quotes - Analyses - Technical - Details

2. How to Use Interpretation of Indicators?
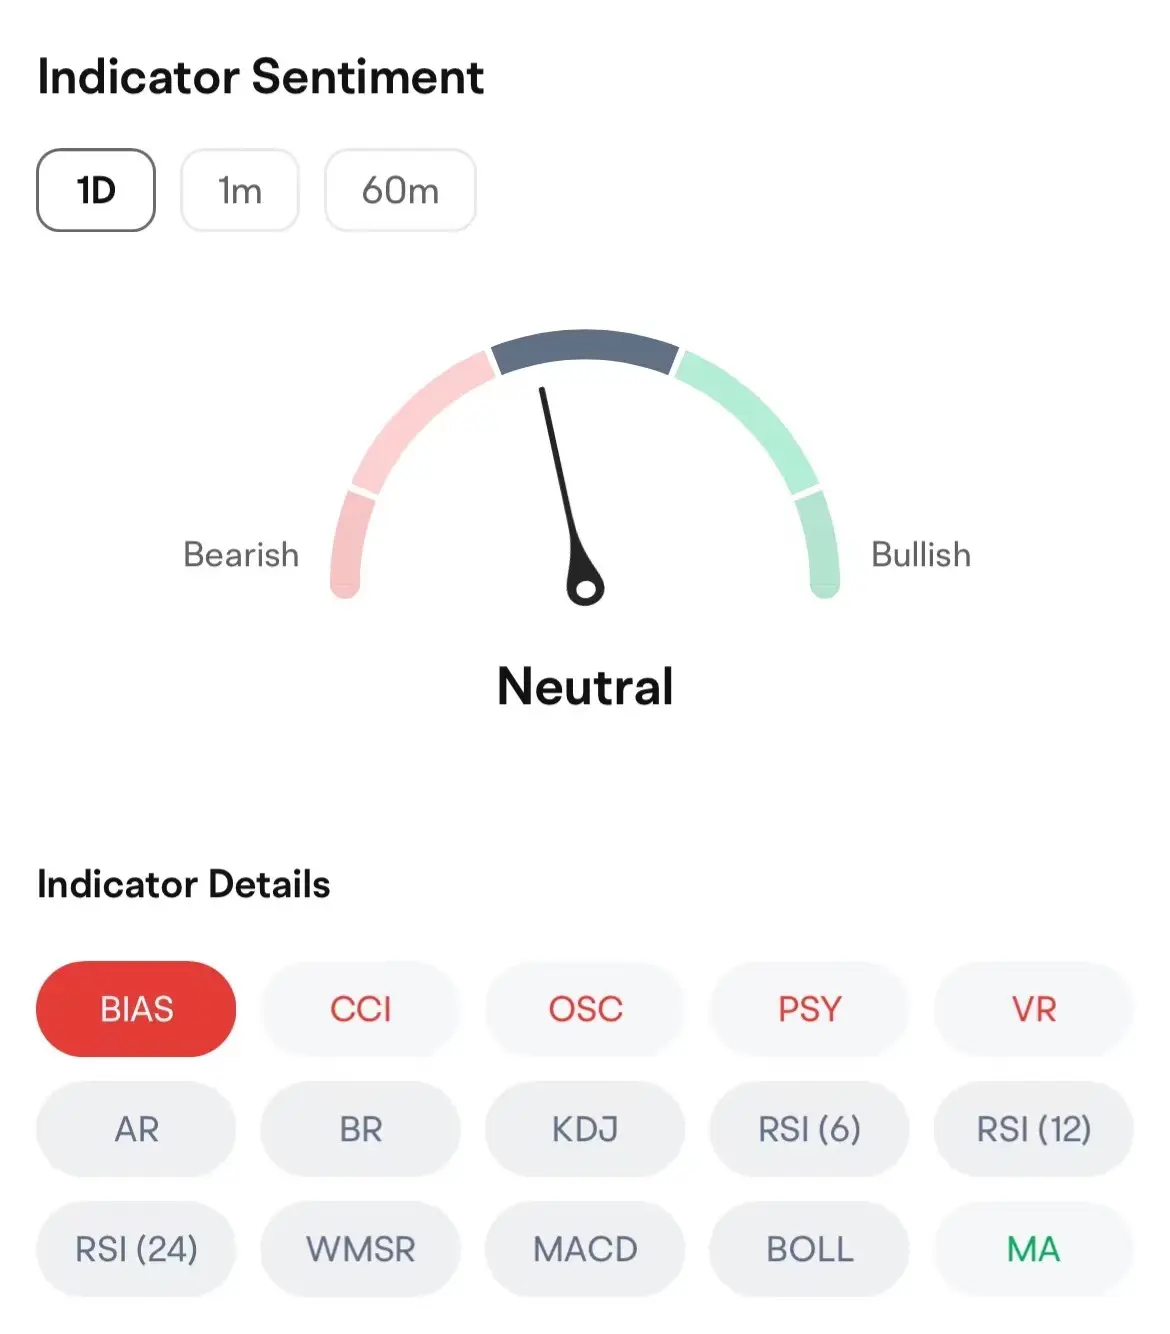
2.1 Indicator Sentiment
The dashboard presents the overall status of all technical indicators, and supports switching to view different candle chart period.

|
Signals |
Meaning |
|
Danger |
The trend is bearish, and the risk is relatively high |
|
Warning |
The trend is relatively bearish |
|
No Obvious Signal |
The trend is not clear |
|
Positive |
The trend is relatively bullish |
|
Bullish |
The trend is bullish, and there is a great chance of rebound or rise |
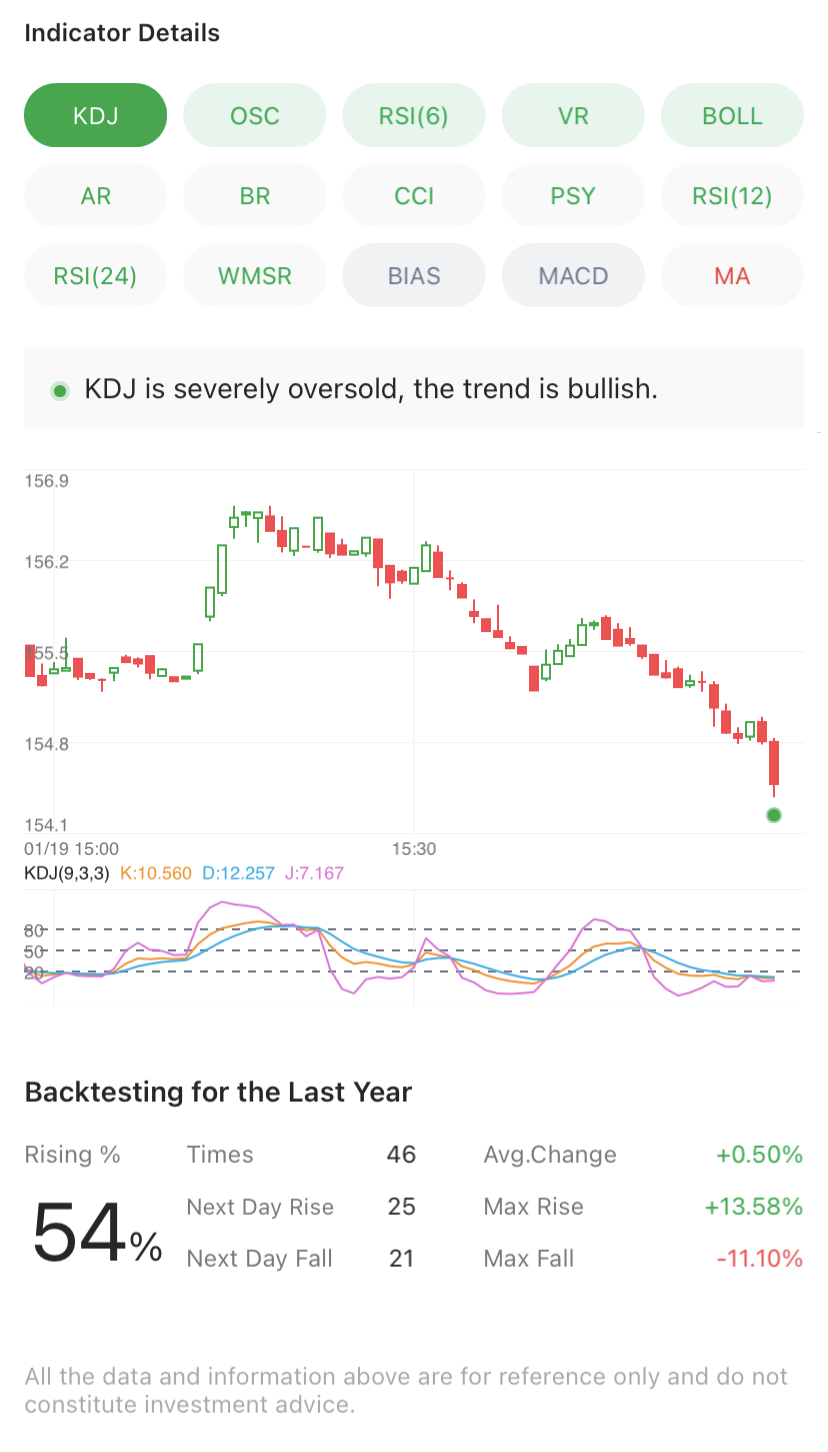
2.2 Indicator Details
Click on each indicator to view the corresponding status.

2.3 Backtesting
Statistics of the past occurrences and ups and downs of the currently selected indicator are shown. Rise % = The Number of Rises in the Next Day / Total
Overview
Market Insights


HK Tech and Internet Stocks HK Tech and Internet Stocks
Stocks of companies primarily involved in technology and internet sectors in the HK stock market. Stocks of companies primarily involved in technology and internet sectors in the HK stock market.
View More
Nancy Pelosi Portfolio Nancy Pelosi Portfolio
Former U.S. House Speaker Pelosi, renowned as the "Stock Market Queen" in politics, concentrates her investment portfolio on tech giants in AI and semiconductors. Her core strategy involves purchasing call options for leveraged trading to maximize potential returns. Former U.S. House Speaker Pelosi, renowned as the "Stock Market Queen" in politics, concentrates her investment portfolio on tech giants in AI and semiconductors. Her core strategy involves purchasing call options for leveraged trading to maximize potential returns.
Invest with Futu! Invest with Futu!
Hot Topics Hot Topics
Tariff game between the US and Europe shakes the market! Will TACO happen again?
Amidst the global market turbulence triggered by the US-Europe dispute over Greenland, a single post by Trump instantly reversed market tren Show More
Futubull Options Sir
Jan 19 17:47
Options Weekly 0119 | Greenland tariff standoff, gold and silver surge again, shocking reversal in Fed chair nominee! Watch Intel, Netflix earnings reports
年頭旺到年尾
Jan 25 15:05
2026 Futu Creators Conference
- No more -