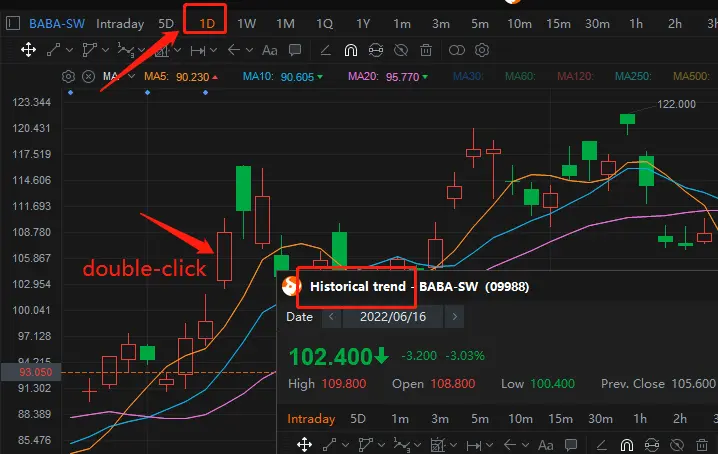
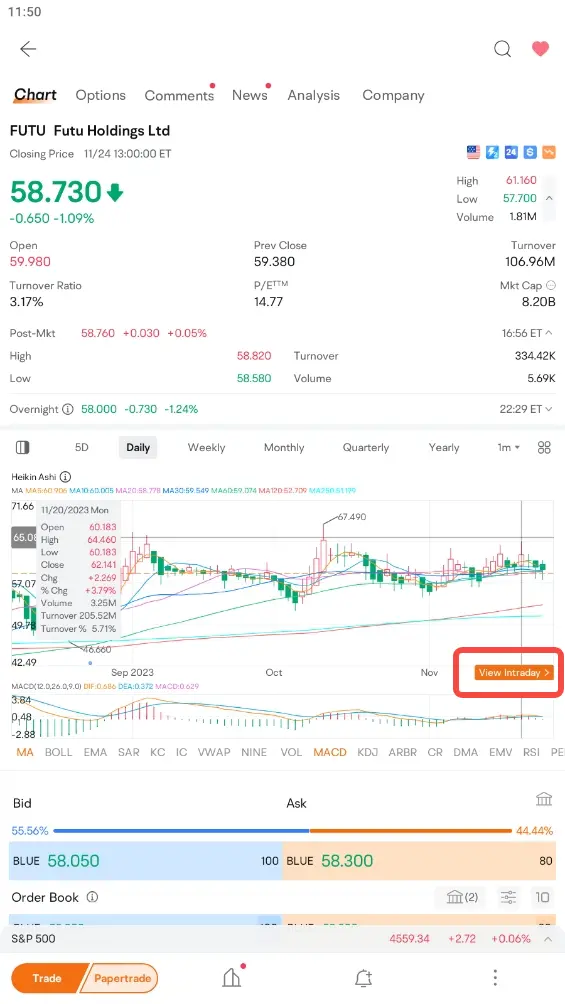
How to view the daily time frame chart of historical K-line
1. Moving end
In the 1D chart of the stock quote page, you can call out the cross line and click tok line to view the time of day. Then, you can view the historical trend for that day.
2. Desktop end
In the 1D chart of the stock quote page, you can double-click the k line to view the historical trend for that day.