Institutional Tracker
1. Navigation
Mobile: Tap Markets > Explore.

Desktop: Click on Explore > AMC Holdings.
2. Introduction
2.1 Rationale
The US Securities Regulatory Commission (SEC) requires fund managers of institutions with assets under management of more than $100m to provide the SEC with quarterly position reports. By tracking the securities held by these institutions, investors can understand their investing logic and trends, and learn from their investing strategies.
2.2 Home Page
You will see Top Institutions, Hot Industries, and Trending Stocks on the home page. In particular, the heat map under Hot Industries shows the market value of institutional holdings by industry. A bigger cell size means a higher market value, which indicates the industry has more growth potential.
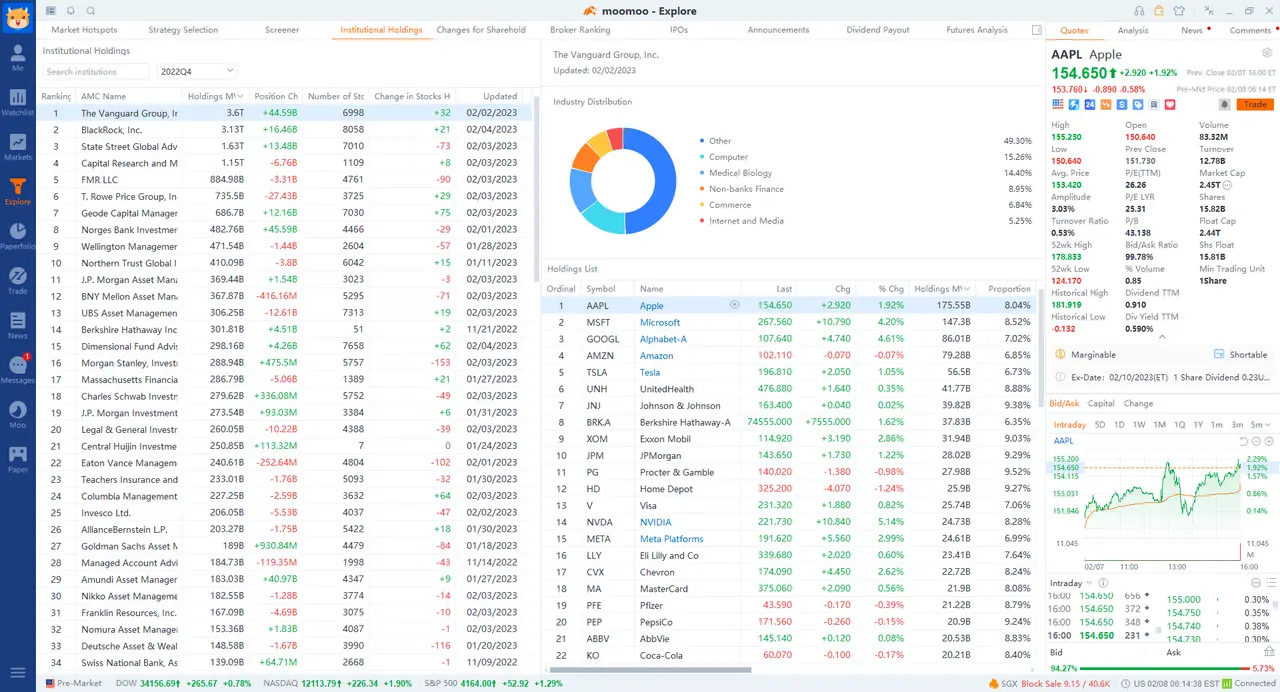
 2.3 Top Institutions Page
On the Top Institutions page, you can find a search box, an institution number & MV chart, and a top institutions list.
2.3.1 Institution Number & MV Chart
The chart shows the total number of institutions and the total MV (market value) of institutional holdings by quarter.
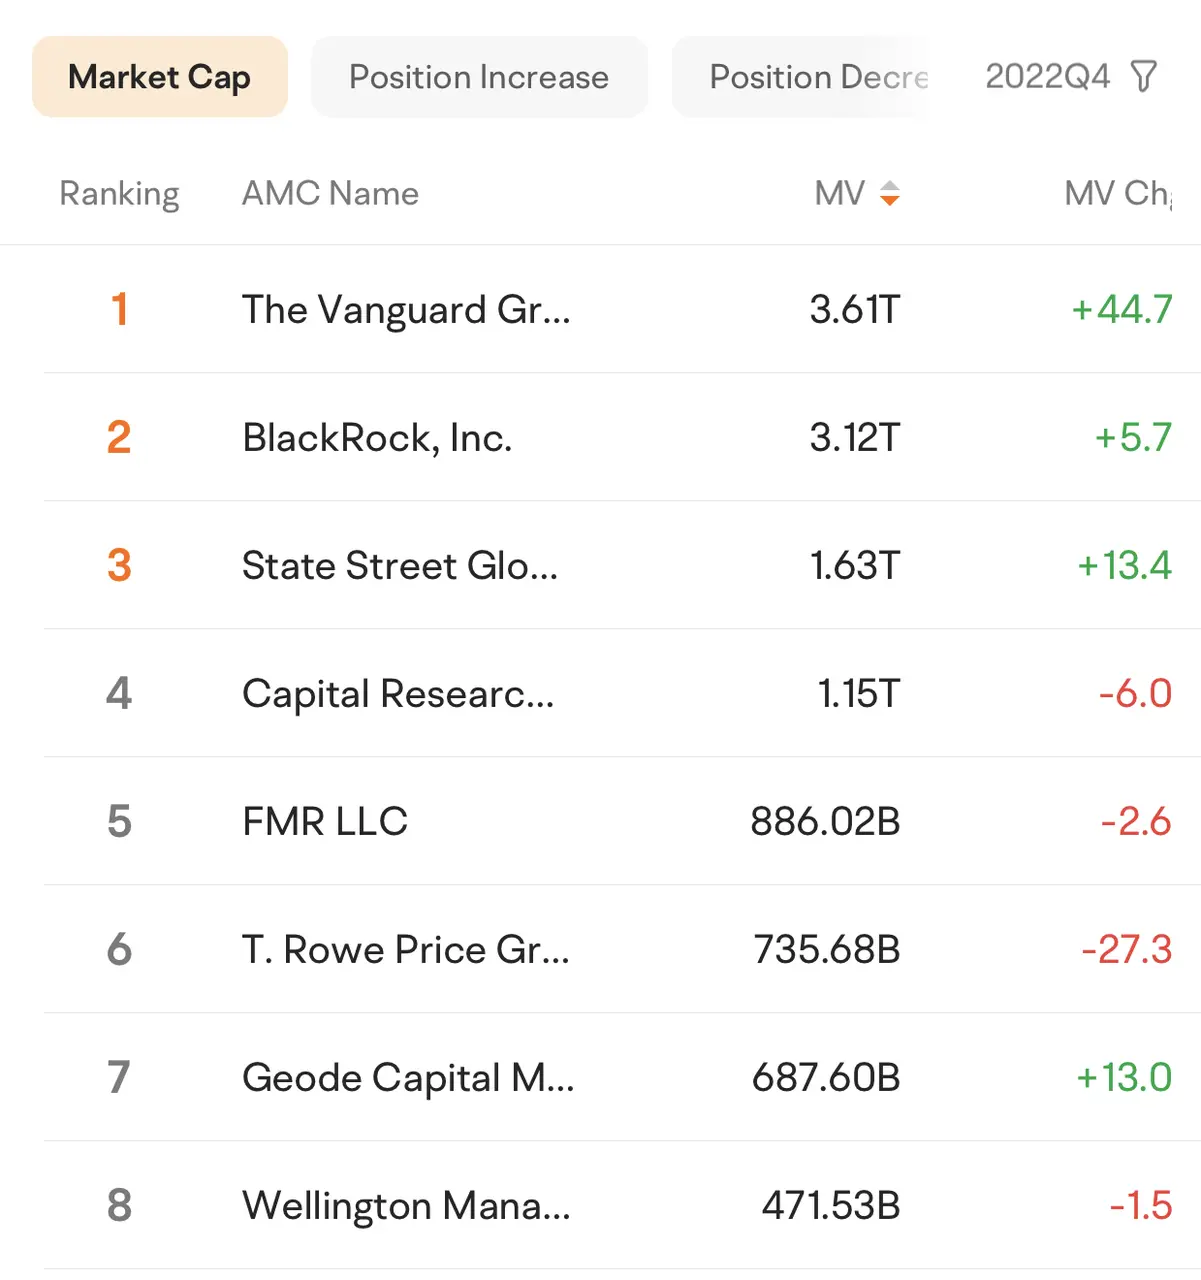
 2.3.2 Top Institutions List
This module gives three types of rankings. The first list ranks the institutions by market value of holdings, and the other two, by change in holdings. In the list, you may find the following information, as well as its last updated dates:
● MV: the market value of the stocks held by the institution for the current period
● MV Chg: changes in the market value of the stocks held by the institution for the current period
● Number of Stocks Held: the number of shares held by the institution
● Change in Stocks Held: changes in the number of shares held by the institution as compared to the previous period
2.4 Detailed Holdings Page
Tapping an institution leads you to its detailed holdings page. You may find three modules on this page, i.e. Overview, Industry Distribution, and Holdings List.
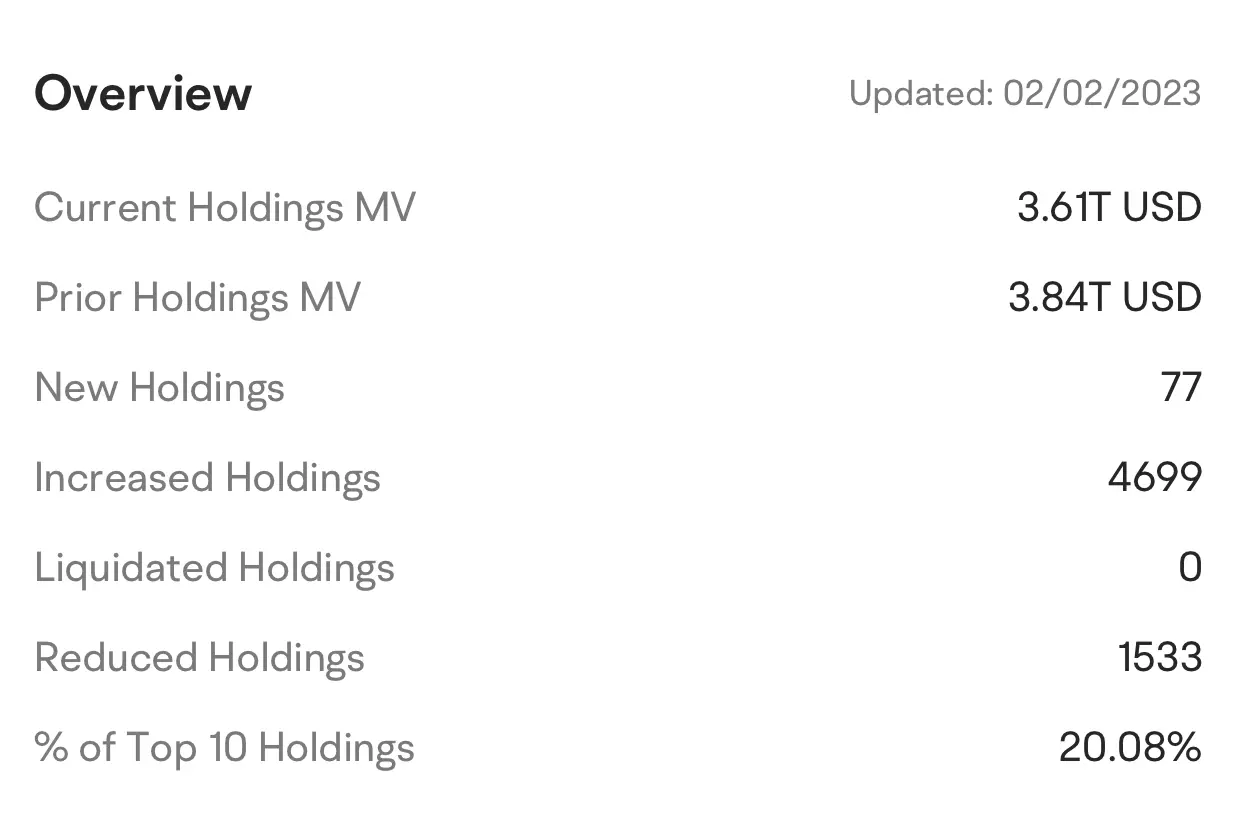
2.4.1 Overview
This module provides the following information:
● Current Holdings MV: the market value of the stocks held by the institution for the current period
● Prior Holdings MV: the market value of the stocks held by the institution for the previous period
● New Holdings: the number of shares of the stocks newly held by the institution
● Increased Holdings: the number of shares, of currently held stocks, newly bought by the institution
● Liquidated Holdings: the number of shares of the stocks sold out by the institution
● Reduced Holdings: the number of shares, of currently held stocks, sold by the institution
● % of Top 10 Holdings: the proportion of the market value of the top 10 holdings to the total market value of all holdings of the institution
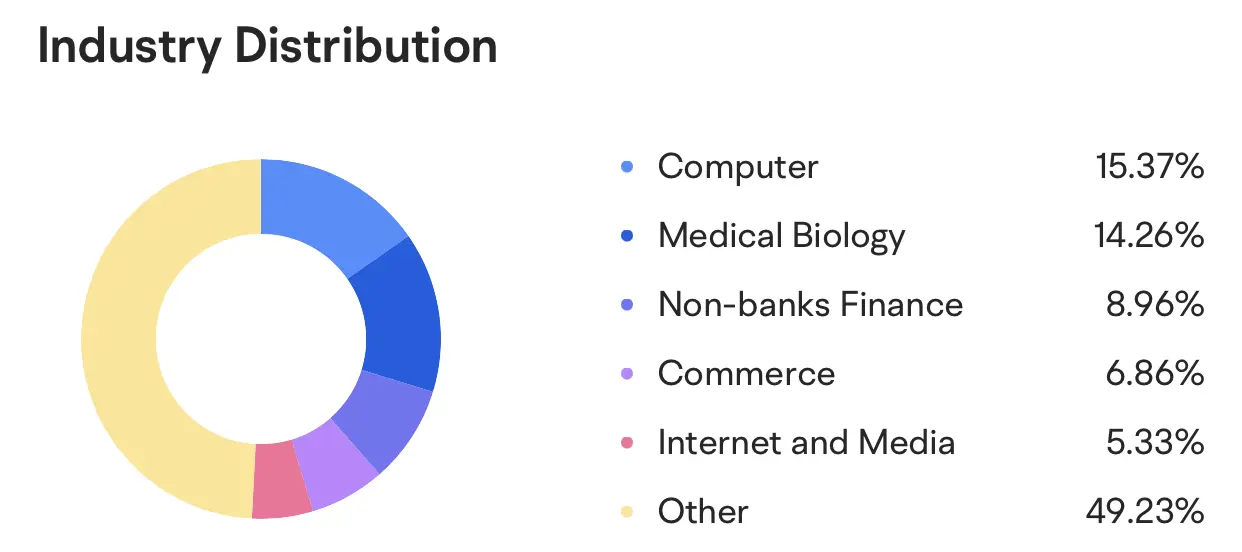
 2.4.2. Industry Distribution
The pie chart in this module presents the proportion of the market value of the institution's holdings in each industry to the total market value of all its holdings.
 2.4.3. Holdings List
This module shows the institution's holdings in each company by market value, in descending order by default. In addition to stock symbols and industries, you may find the following information in the list:
● Holdings MV: the market value of the stock held by the institution
● % of Float: the proportion of the market value of the stock held by the institution to the total market value of the stock
● Last Value: the proportion of the market value of the stock held by the institution for the previous period to the total market value of the stock
● Holdings Chg: changes in the number of shares of the stock held by the institution
● % of Holdings Chg: the proportion of changes in the number of shares to the total shares outstanding for the previous period
● % of Portfolio: the proportion of the market value of the stock held by the institution to the total market value of all its holdings
