FUTUBULL Help Center-Bearish continuation triangle
English
Back
Open Account

Bearish continuation triangle

1. Introduction

Bearish Continuation Triangle is a pattern formed by two converging trend lines. This pattern means that the current downtrend is likely to continue.


2. Feature

2.1 The bearish continuation triangle occurs after the fall of stock price, followed by several violent fluctuations;

2.2 The bearish continuation triangle is formed by two converging trend lines. The two trend lines converge into a triangle, and the lower trend line is nearly horizontal; 

2.3 A bearish continuous triangle. Recently, the price has broken downward through the bottom connecting support line, and it is likely to continue to fall in the future.
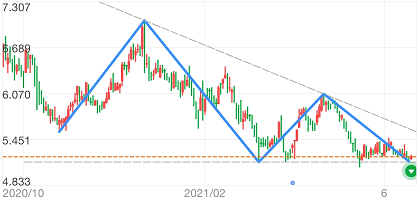

3. Example

00861 has a Bearish Continuation Triangle Pattern on June 18, 2021.


Market Insights

Geopolitical Chaos? Opportunities Await! Geopolitical Chaos? Opportunities Await!

Geopolitical turmoil triggers market volatility, where do investment opportunities lie in chaotic times? Screening Criteria: As of June 23, 2025, select the top four companies by market capitalization in the U.S. energy, defense and aerospace, gold, and uranium sectors, and identify the top five among them based on 10-day price performance using Futubull real-time data. Geopolitical turmoil triggers market volatility, where do investment opportunities lie in chaotic times? Screening Criteria: As of June 23, 2025, select the top four companies by market capitalization in the U.S. energy, defense and aerospace, gold, and uranium sectors, and identify the top five among them based on 10-day price performance using Futubull real-time data.

Unlock Now