Charts
1. Overview
Feature | Description |
switch period | switch period to view different charts |
zoom in/out | zoom in or zoom out of the candlestick charts |
translation | drag left or right to view historical trend |
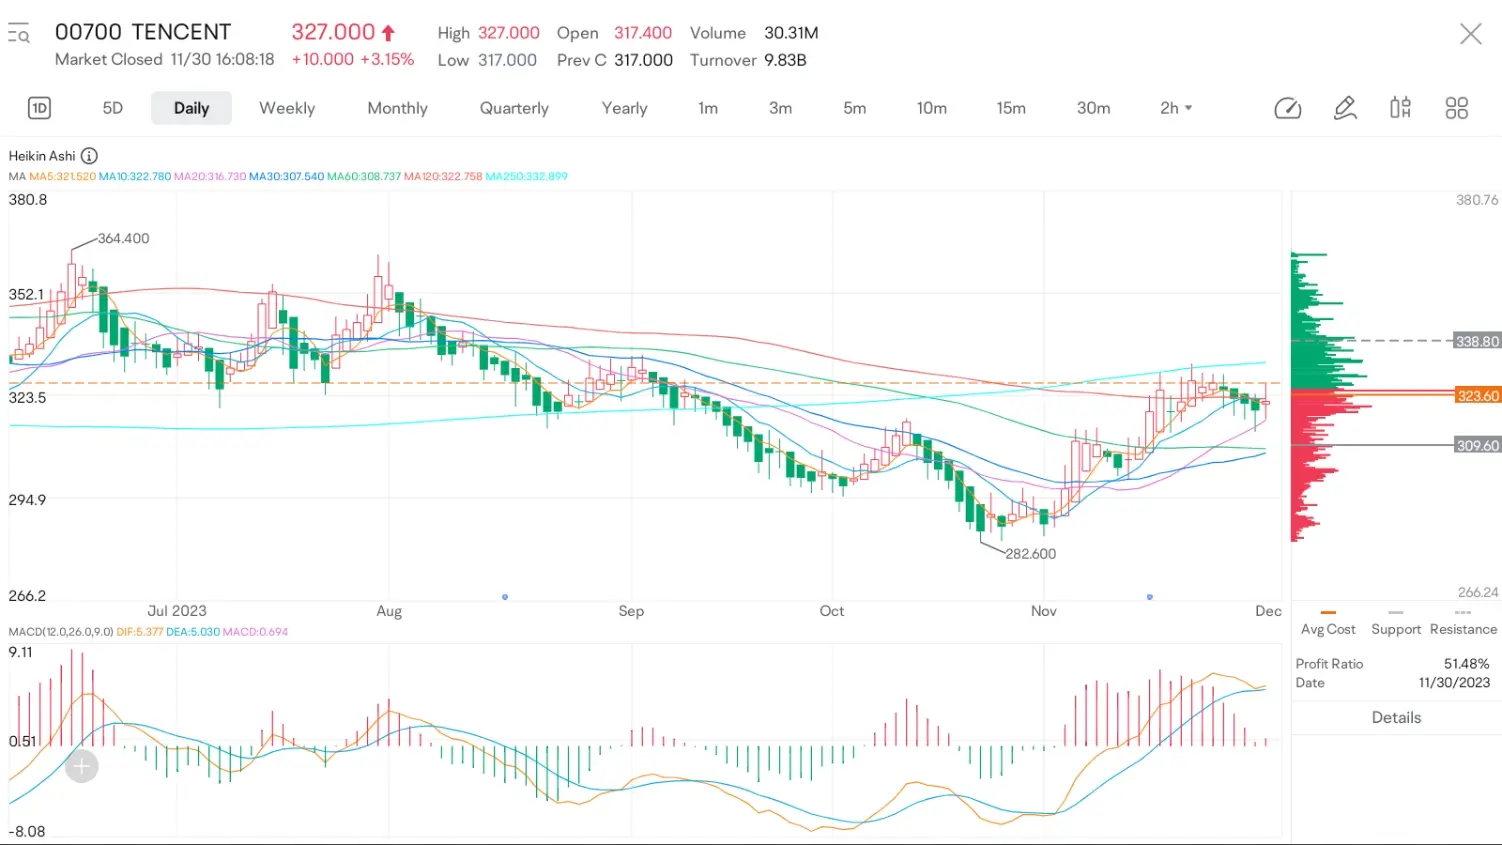
indicators | display technical indicators |
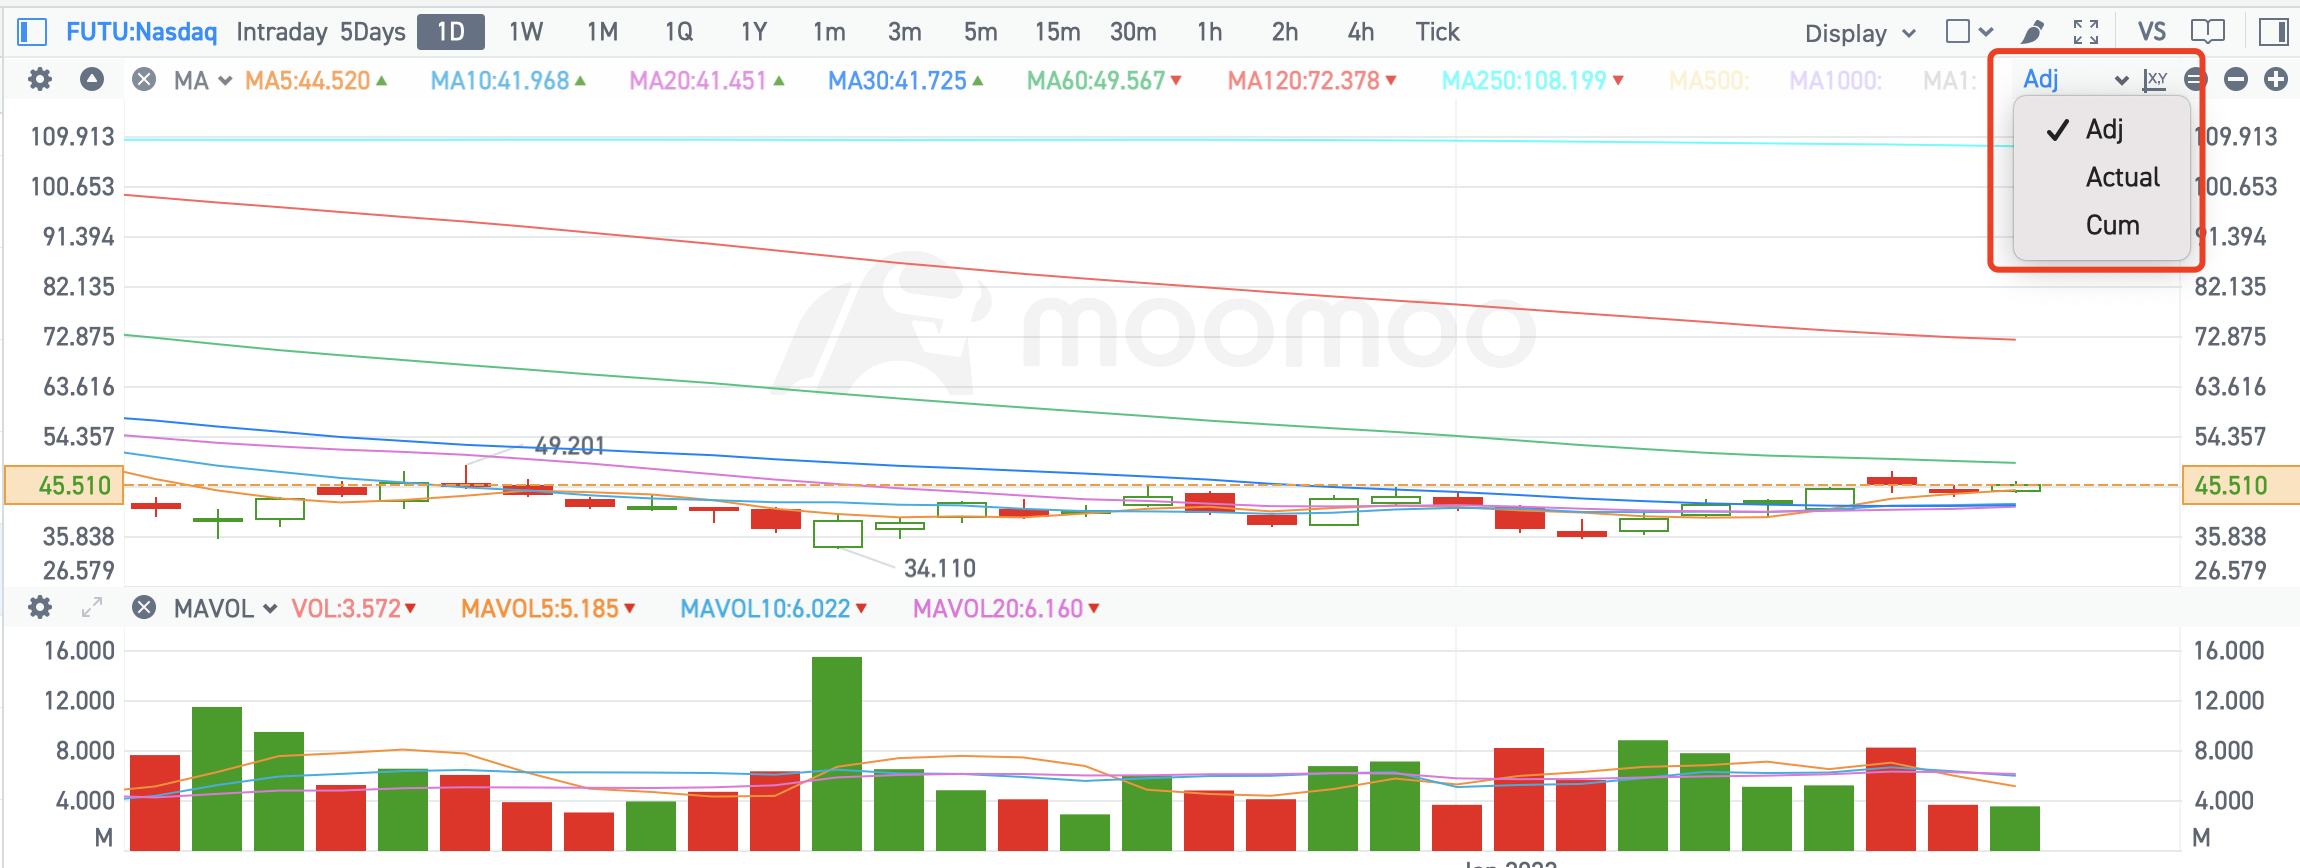
switch adjustment type | switch adjustment type to backward adjusted, actual, or cumulative price. |
settings | display/hide lines on the main chart, such as cost line, show lines, etc. |
1.1 Mobile App
1.2 Desktop
2. User Guide
2.1 Switch Period
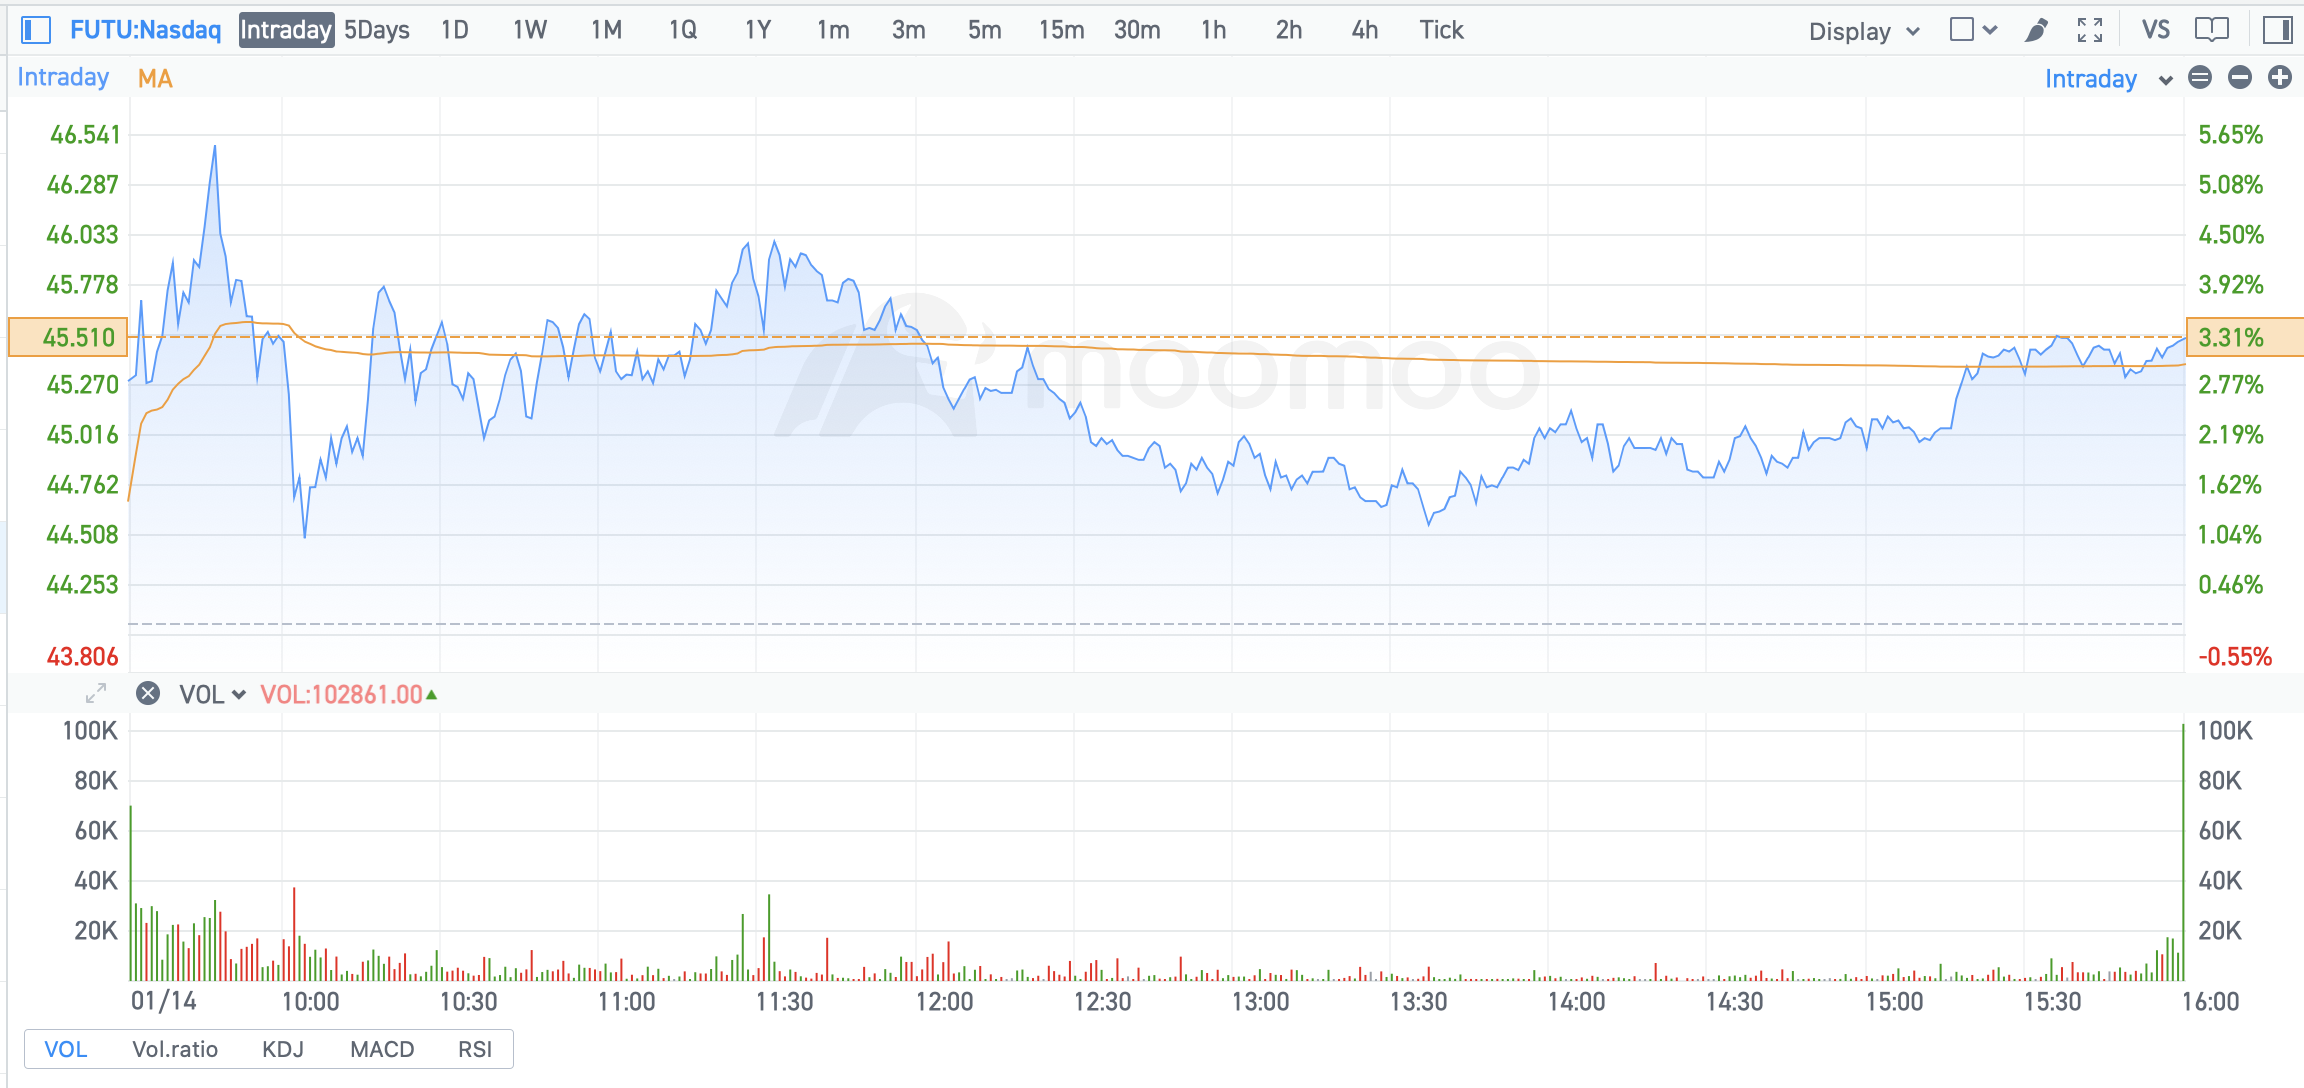
You can switch the period of the candlestick charts by choosing the above tabs. Currently, Futubull support periods such as Intraday, 5D, 1D, 1W, etc.
2.2 Zoom in/out
Mobile app: use two fingers to call up the zoom in/out function; Note: Intraday chart does not support this feature.
Desktop: hover your mouse on the chart to make sure the chart is active, then use the mouse scroll wheel to zoom in/out, or you can click the zoom button on the top-right corner.
2.3 Translation
Mobile app: In the vertical or horizontal mode of the quotation page of the individual stock quotation page, drag the trend chart horizontally with one finger left and right to view the trend outside the screen range;
Desktop: long-press the chart and drag to the historical period you want.
2.4 Switch Adjustment Type
Futubull adjust historical price data to remove gaps caused by stock splits, dividends and distributions. That may cause our charts to look different from other services that do not perform the same adjustments.
Mobile app: click "setting" icon, select adjustment type - adjusted, actual, or cumulative.
Desktop: choose the adjustment type in the top-right corner.