Pattern interpretation
1. Introduction
Pattern interpretation forecasts the stock price trend in the next 3 days via an algorithm that integrates historical candle chart data and the recent stock price trend; at the same time, big data analysis helps screen stocks with matching patterns.
2. How to find the feature
2.1 Pattern Interpretation
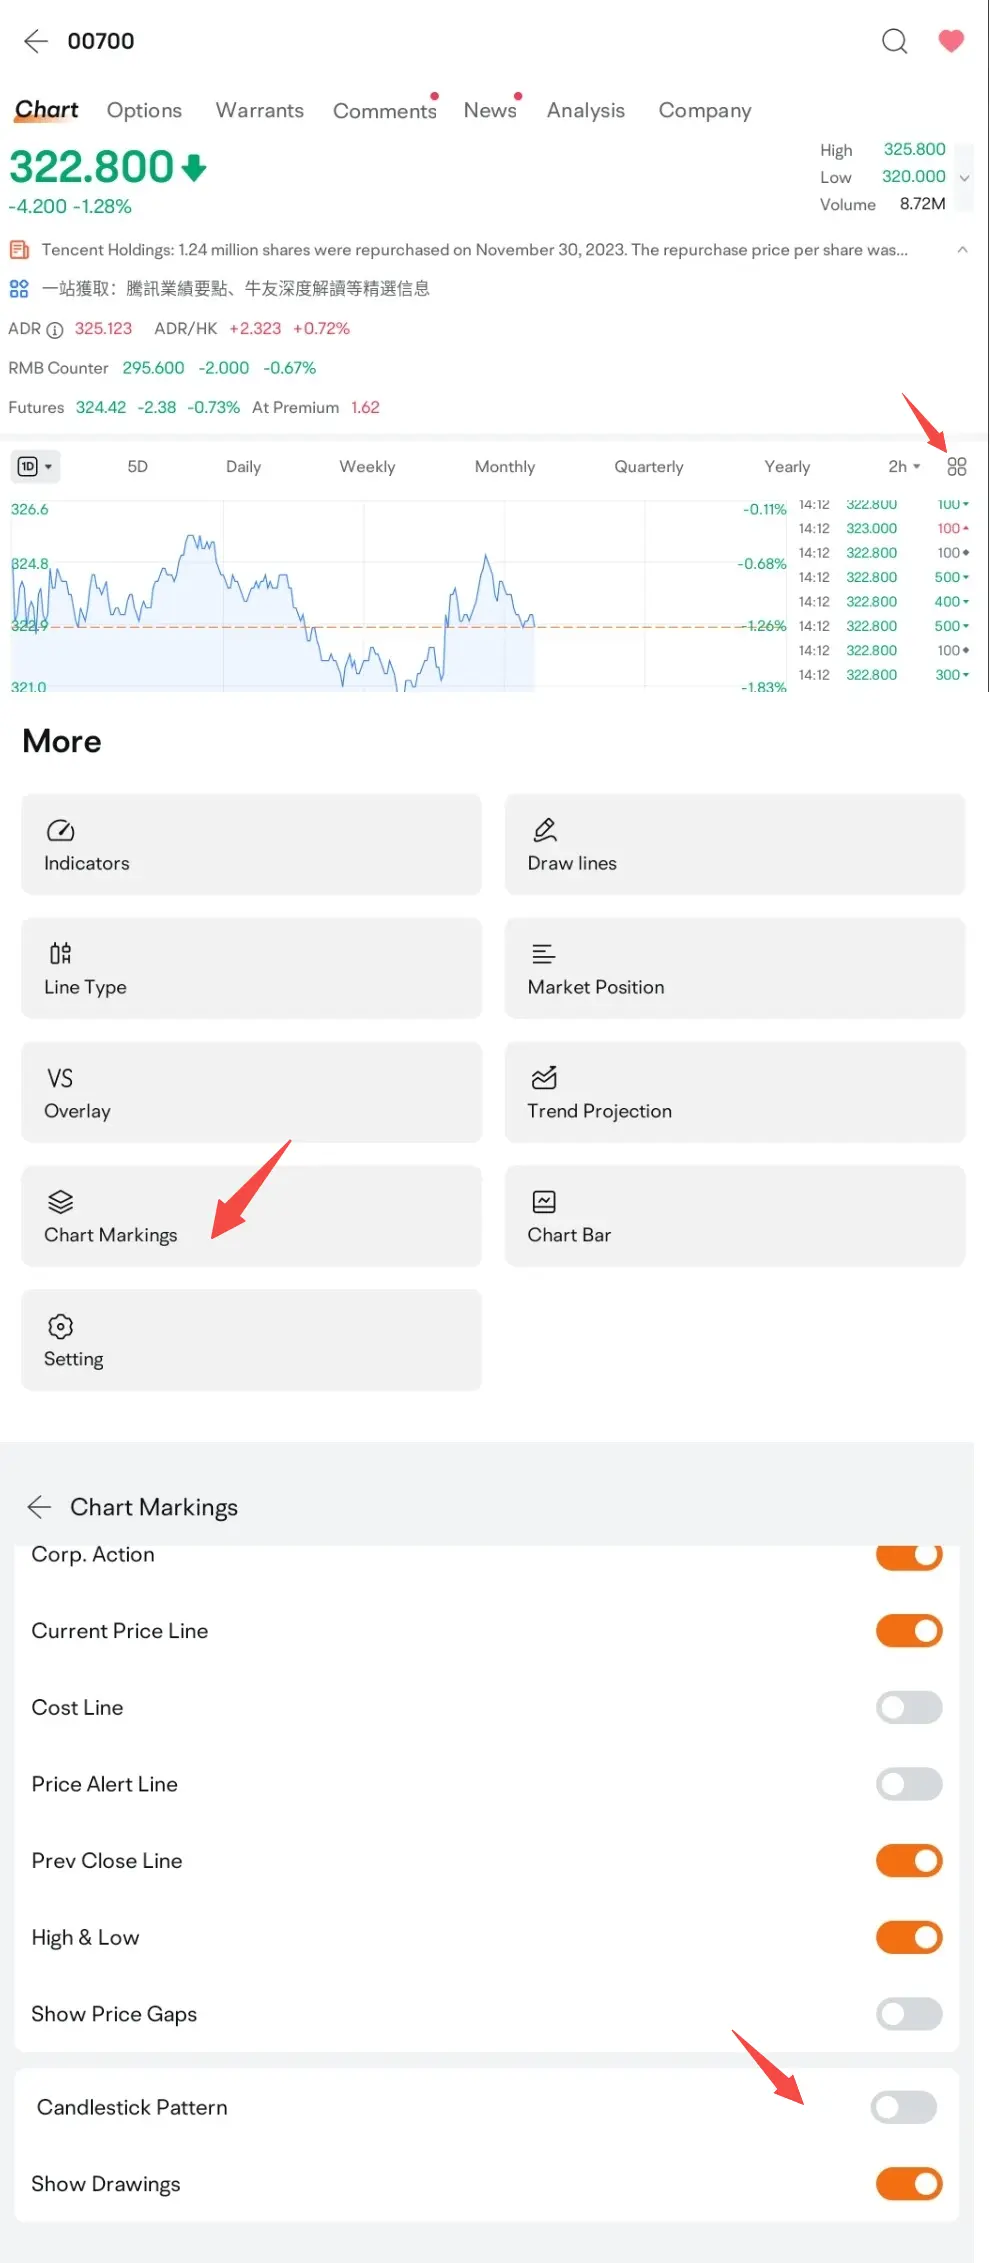
Path: Stock Quote Page > Chart > Daily > Toolbox > Chart Markings > Candlestick Pattern
*Note: To use this feature, a stock's trend should conform to a specific candlestick pattern, and the Candlestick Pattern option should be enabled in the Chart Markings settings.To view stocks that conform to certain candlestick patterns, go to Markets > HK, US, or other stock pages > Candlestick Patterns.
(Please note that the application interface and its content shown above may differ from the actual application interface and content. To avoid any discrepancies, please update the application to the latest version available. The securities mentioned in the screenshot are for illustrative purposes only and should not be construed as investment advice.)
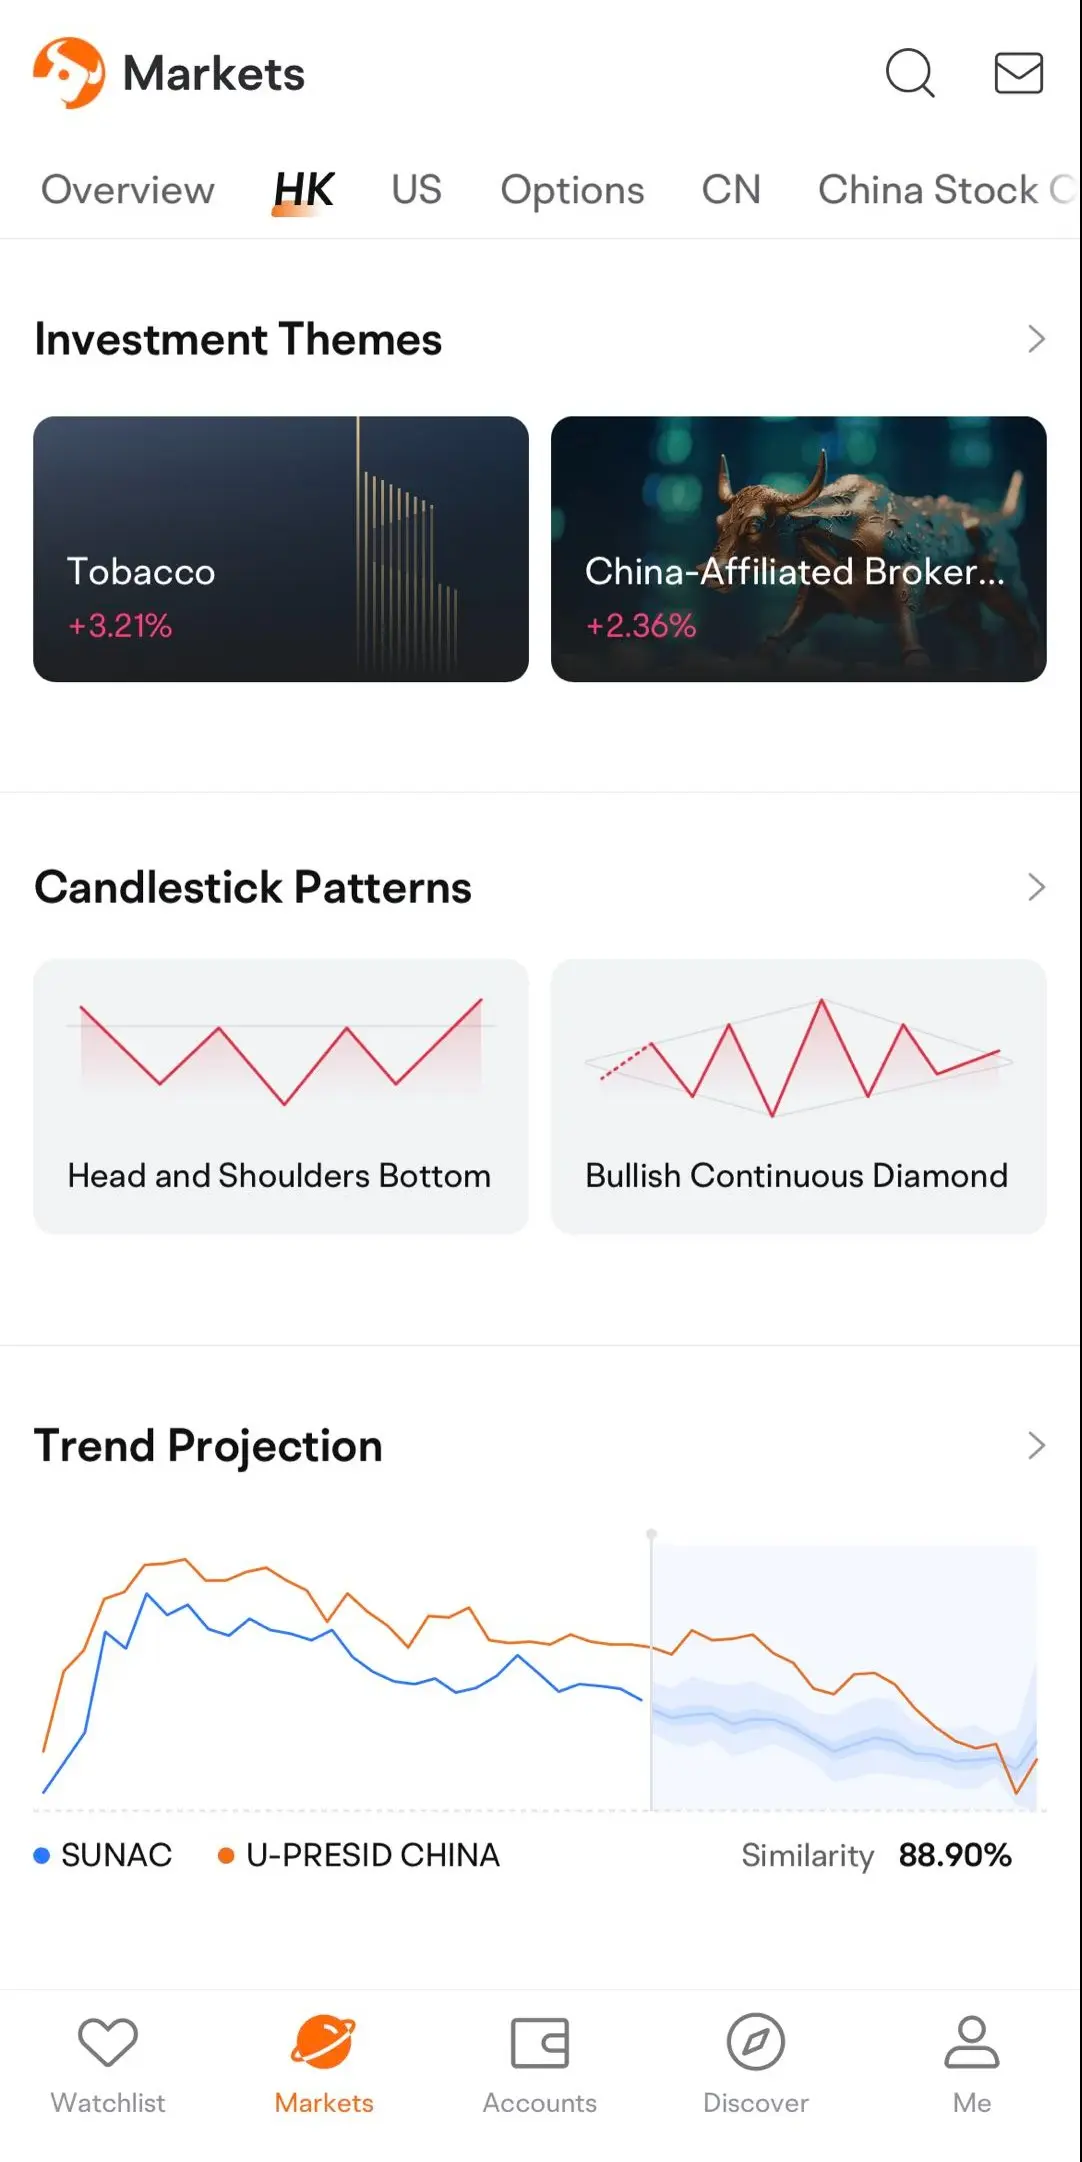
2.2 Pattern Screener
Path: Markets > HK > Candlestick Patterns
(Please note that the application interface and its content shown above may differ from the actual application interface and content. To avoid any discrepancies, please update the application to the latest version available. The securities mentioned in the screenshot are for illustrative purposes only and should not be construed as investment advice.)
3. How to use the feature
The candle chart pattern feature consists of pattern interpretation and pattern screener.
(Please note that the application interface and its content shown above may differ from the actual application interface and content. To avoid any discrepancies, please update the application to the latest version available. The securities mentioned in the screenshot are for illustrative purposes only and should not be construed as investment advice.)
3.1 Pattern Interpretation
● Path: Stock Quote Page > Chart > Daily > Toolbox > Chart Markings > Candlestick Pattern
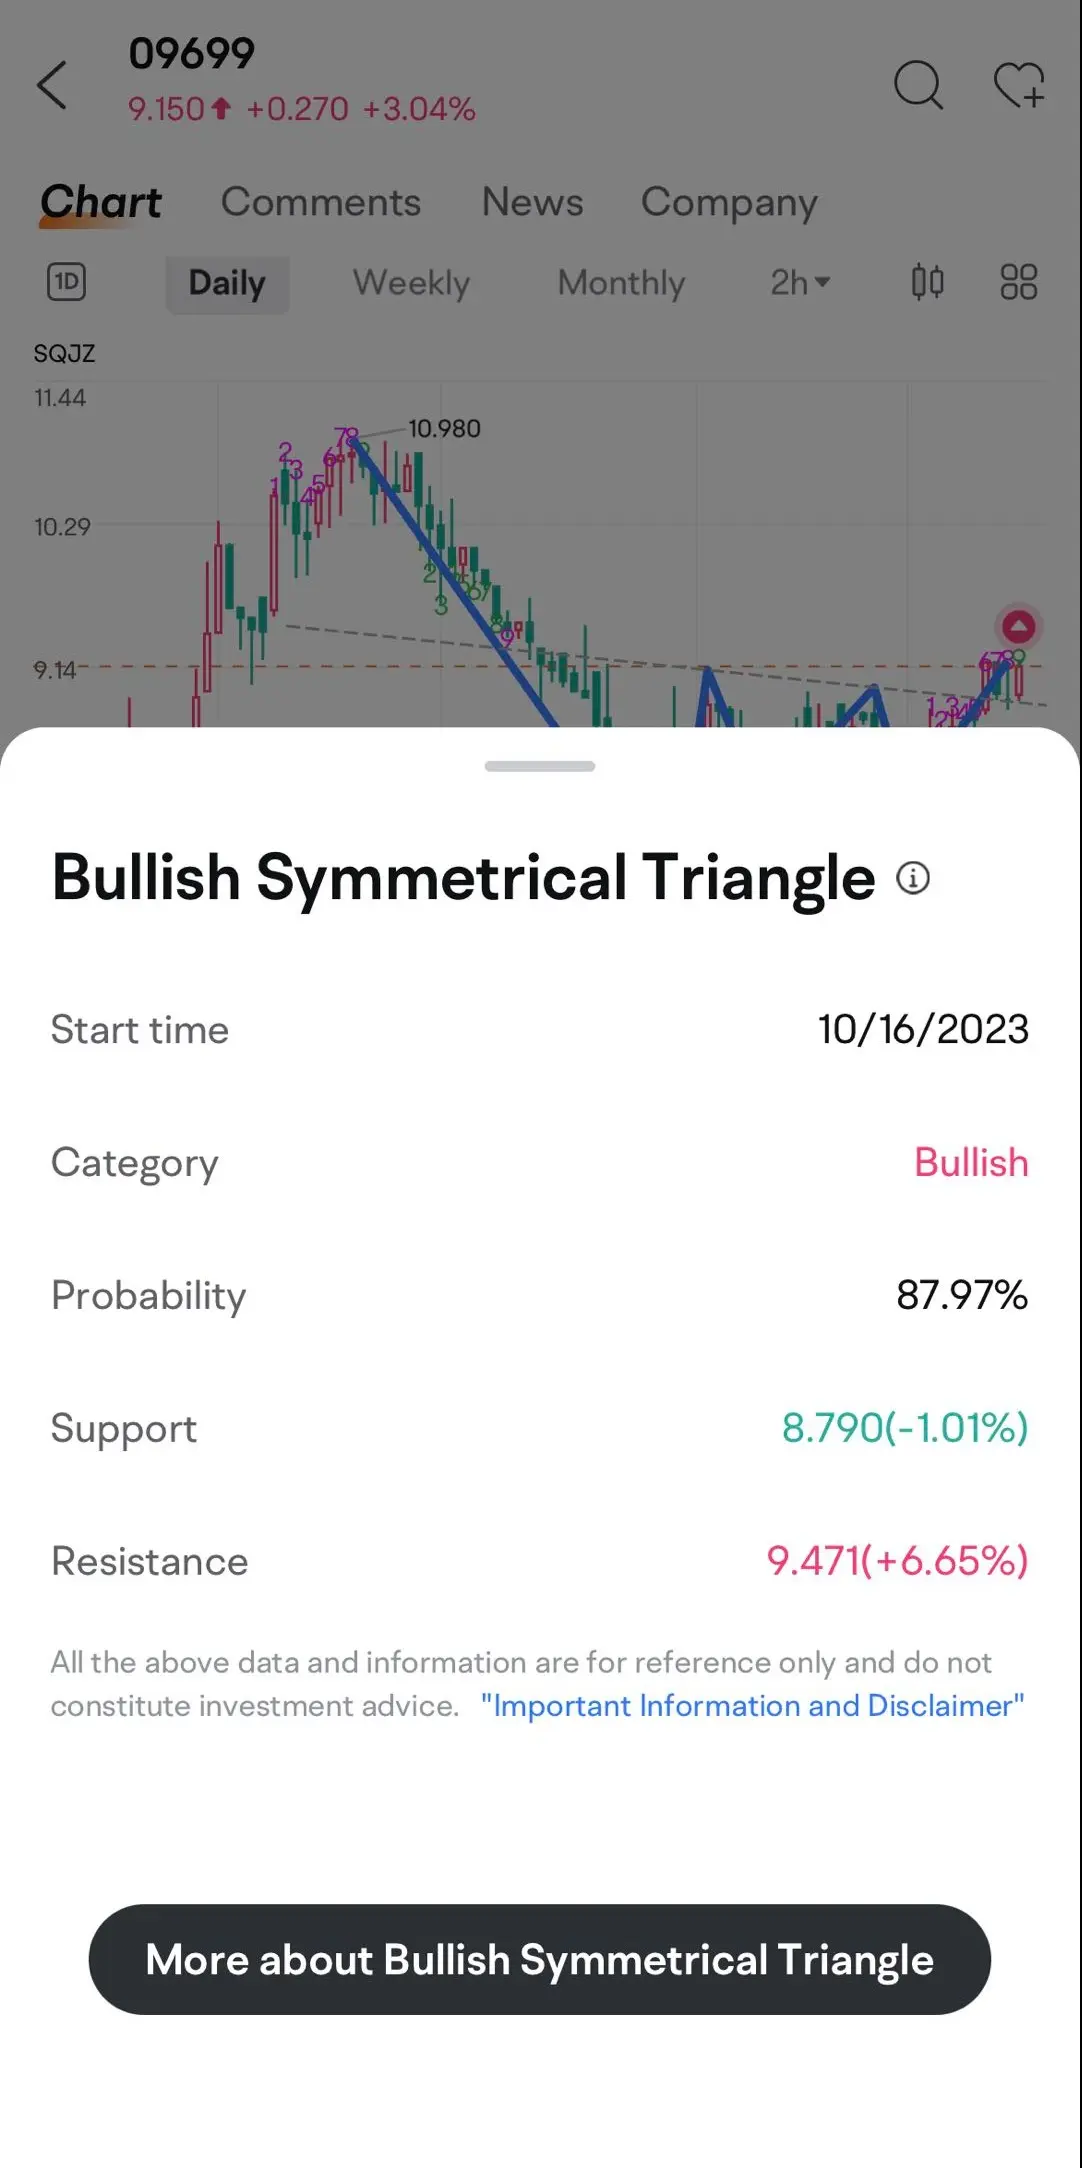
● Introduction: For users' reference, pattern interpretation forecasts the stock price trend for the next three days on the basis of historical candle chart patterns and recent price-volume changes of the stock.
● Starting Time: The time when the pattern appeared
● Pattern Types: Bearish or Bullish
● Probability of Rising/Falling: A forecasting indicator showing an estimate of how likely the stock is to rise or fall in the next three days once this pattern appeared;
● Reversal Probability: A reference probability that the current stock price trend might reverse;
● Support Level: A forecasting indicator showing the stock price that may constitute a support level in the next three days once this pattern appeared;
● Resistance Level: A forecasting indicator showing the stock price that may constitute in the next three days once this pattern appeared;
3.2 Pattern Screener
(Please note that the application interface and its content shown above may differ from the actual application interface and content. To avoid any discrepancies, please update the application to the latest version available. The securities mentioned in the screenshot are for illustrative purposes only and should not be construed as investment advice.)
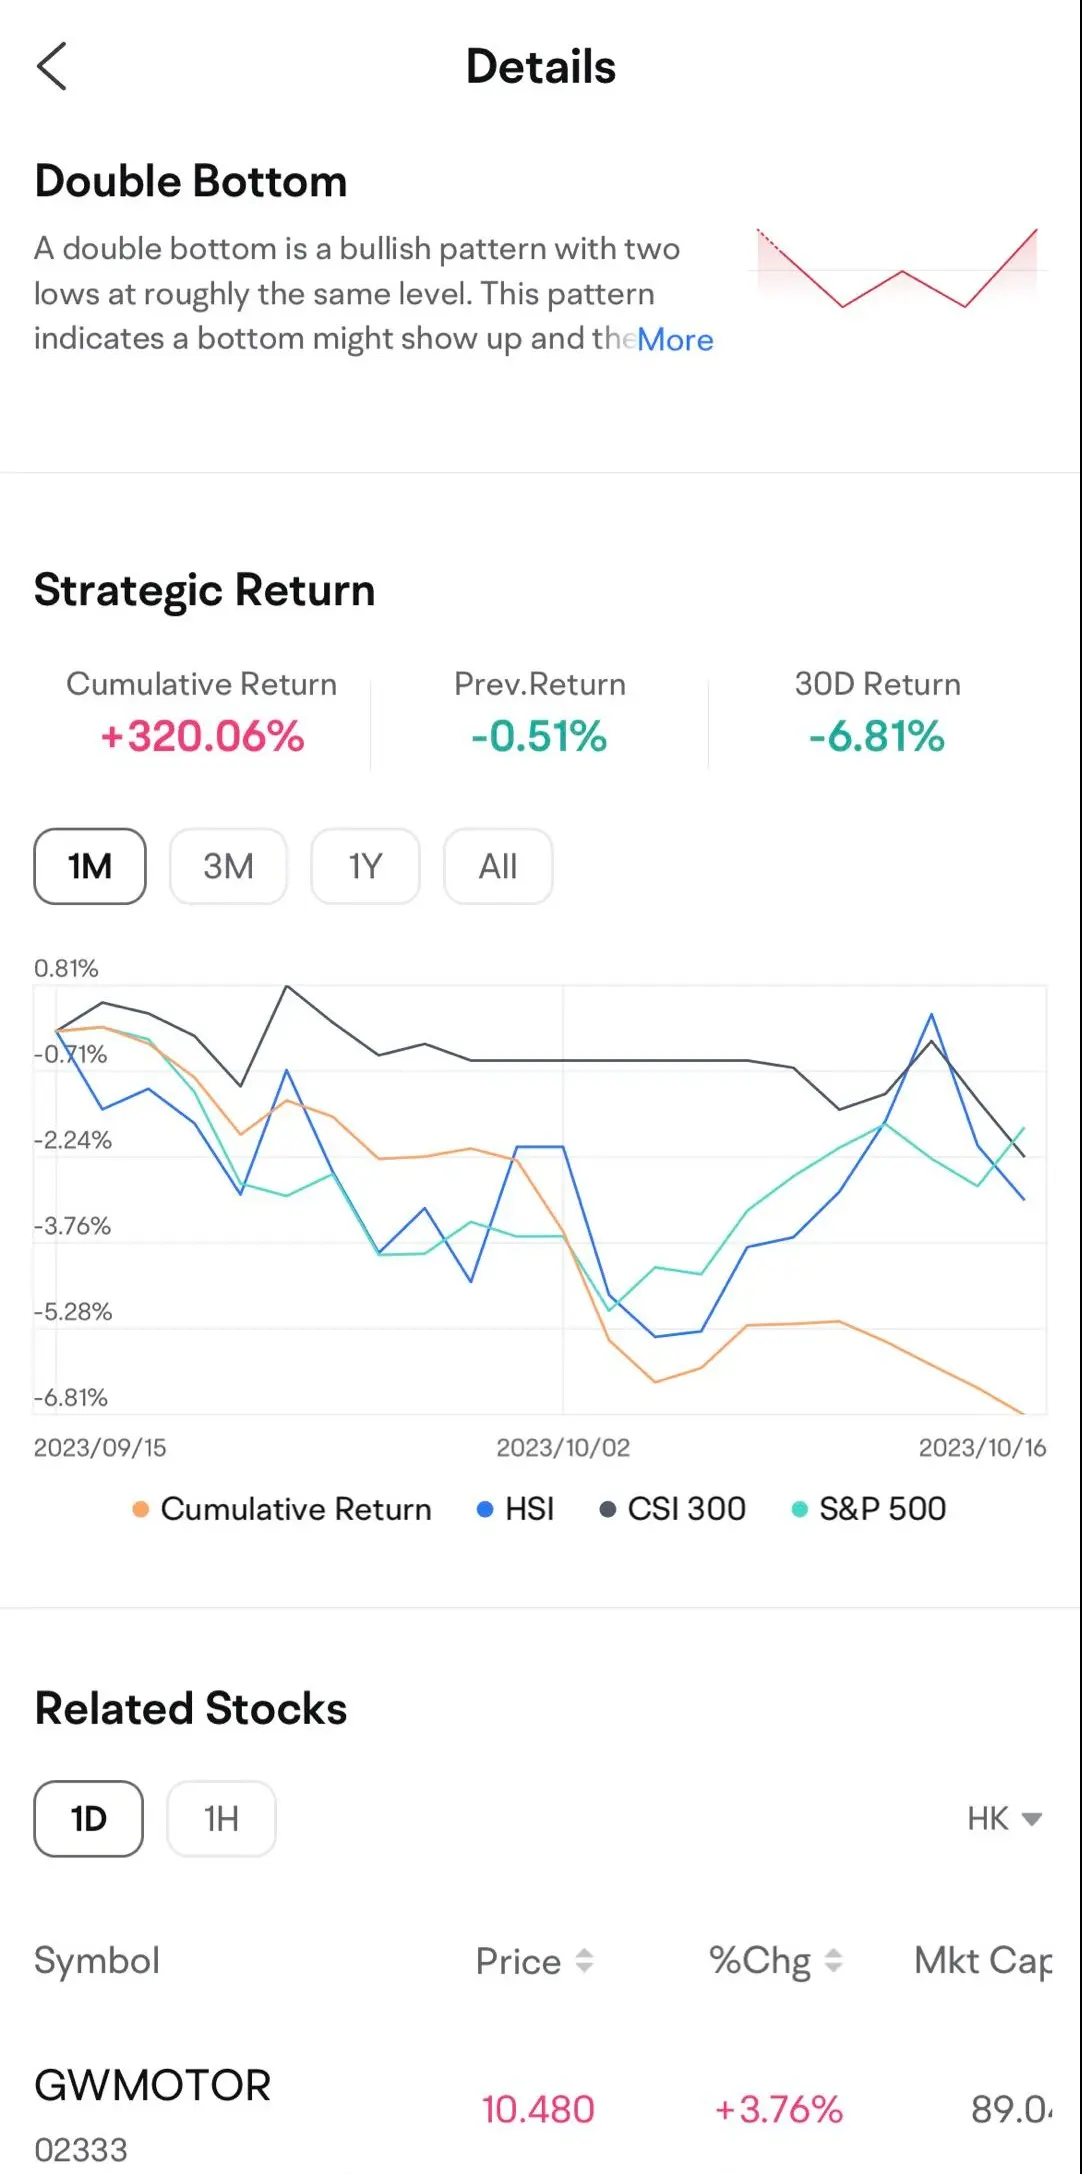
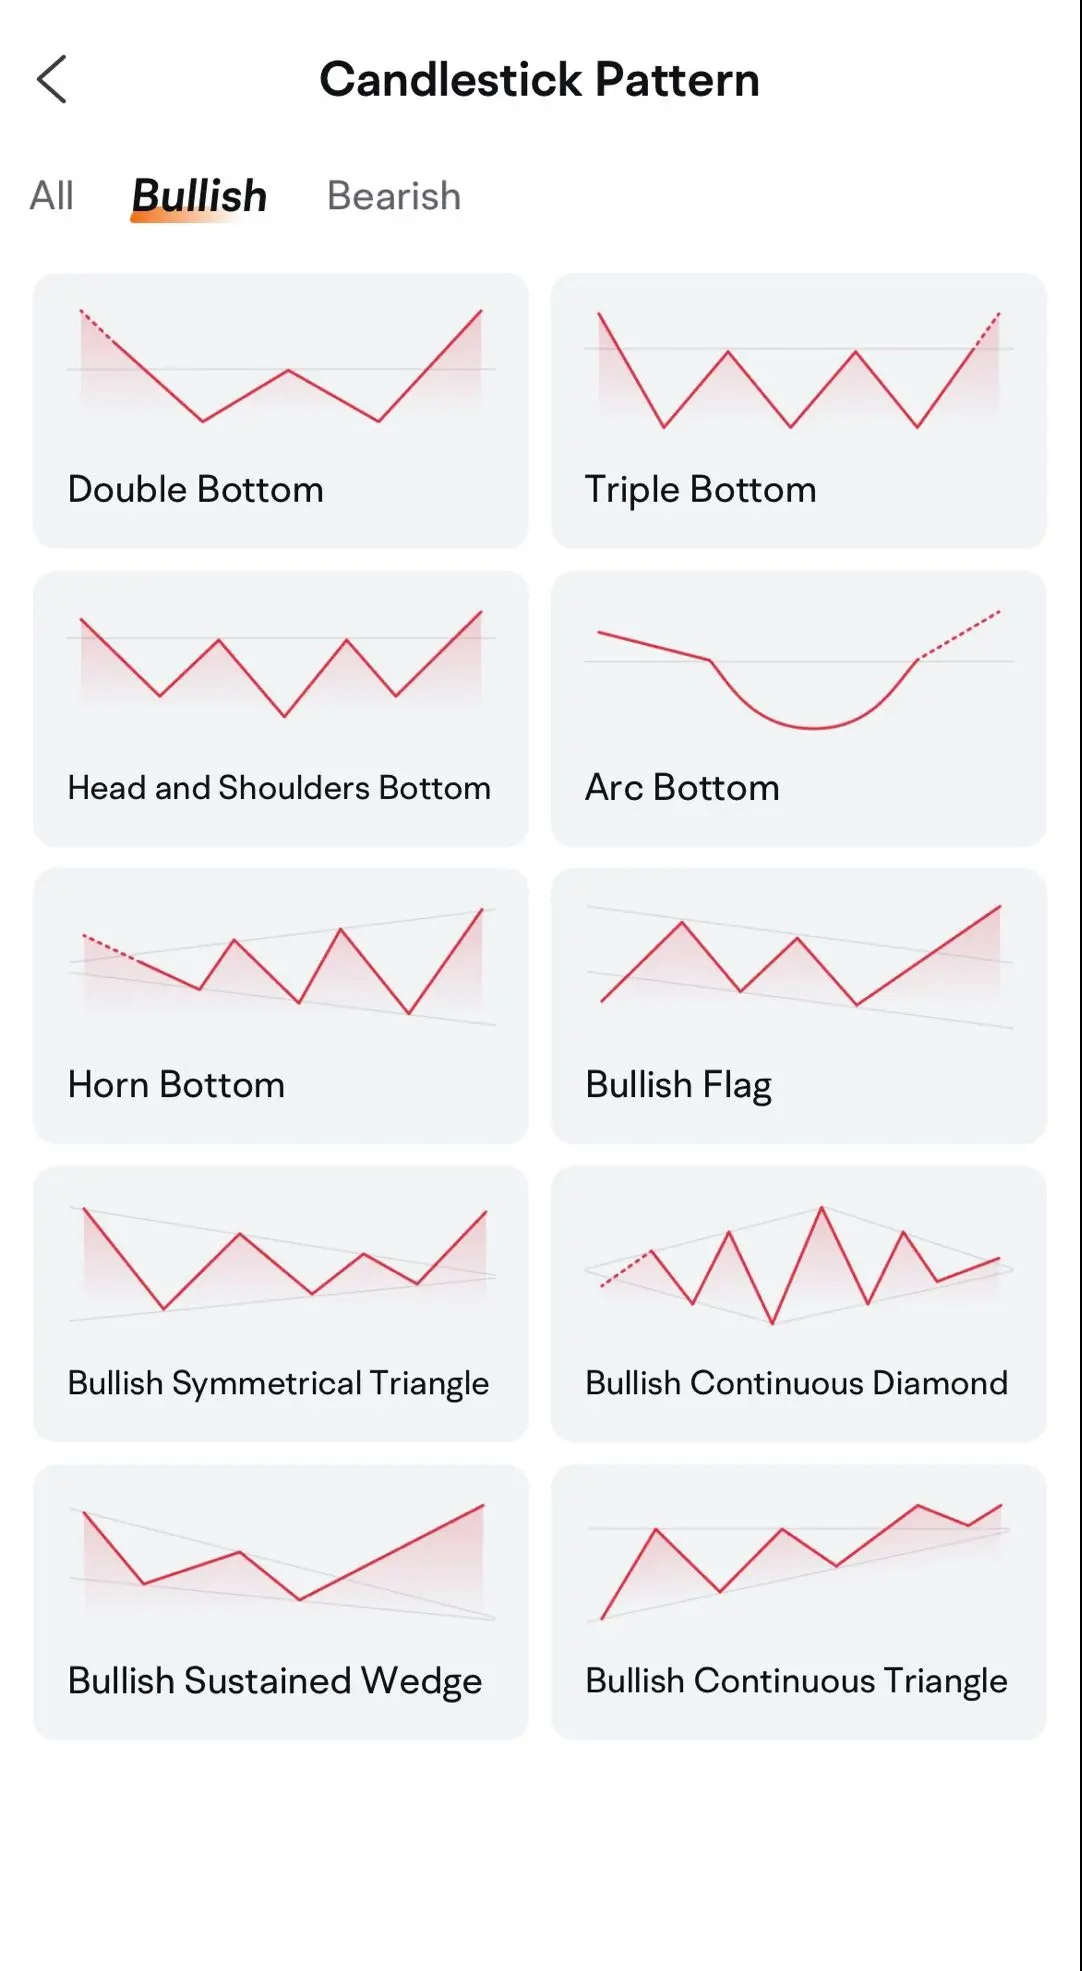
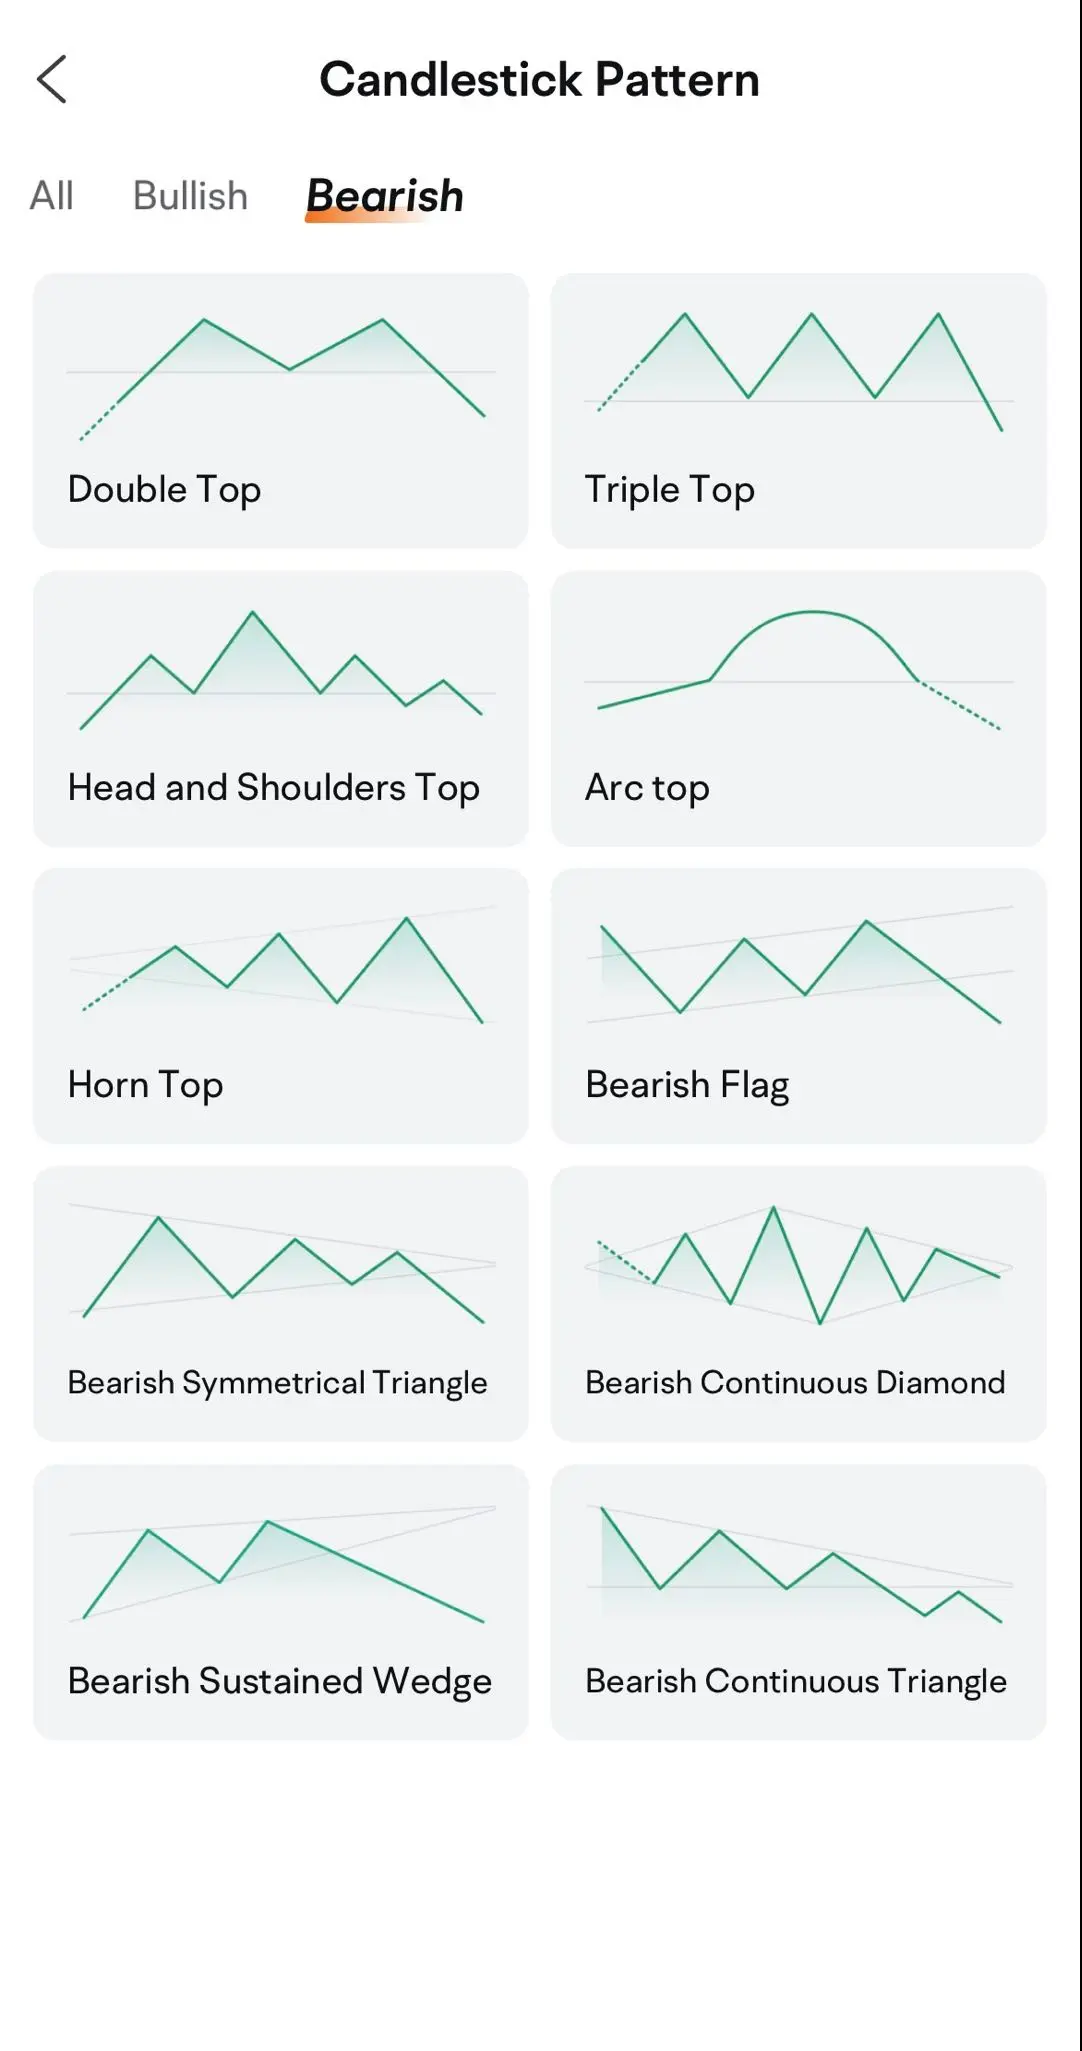
Pattern screener is to automatically identify stocks through the system, and select the stocks that best fit the pattern. Pattern stock picking currently supports 20 patterns, namely:
● Bullish Patterns (10 Types): Double Bottom, Triple Bottom, Head and Shoulders Bottom, Rounding Bottom, Broadening Wedge Bottom, Bullish Flag, Bullish Symmetrical Triangle, Bullish Continuation Diamond, Bullish Continuation Wedge, and Bullish Continuation Triangle
(Please note that the application interface and its content shown above may differ from the actual application interface and content. To avoid any discrepancies, please update the application to the latest version available. The securities mentioned in the screenshot are for illustrative purposes only and should not be construed as investment advice.)
● Bearish Patterns (10 Types): Double Top, Triple Top, Head and Shoulders Top, Rounding Top, Broadening Wedge Top, Bearish Flag, Bearish Symmetrical Triangle, Bearish Continuation Wedge, and Bearish Continuation Triangle.
(Please note that the application interface and its content shown above may differ from the actual application interface and content. To avoid any discrepancies, please update the application to the latest version available. The securities mentioned in the screenshot are for illustrative purposes only and should not be construed as investment advice.)
4. Disclaimer and Risk Disclosure
4.1 Financial Analysis Function and Pattern Interpretation Function (「Advanced Function」 or 「This Function」) are data application service, provided by Futu Securities International (Hong Kong) Limited (「Futu Securities」). The person who uses this function, shall agree to be bound by the terms and limitations set out in Service Agreement.
4.2 Advanced Function is provided solely on the basis that the user has the capability to independently making investment decisions. Such investment decisions will be based on his/her own independent assessment of objective, needs, opportunities and risks of a potential investment, market factors and other investment considerations. Otherwise, please do not proceed to the next step.
4.3 Advanced Function aims to provide services in Hong Kong. For some jurisdictions or countries (such as the United States, Singapore, etc.), using Advanced Function may be considered as violating local laws and regulations. The information, tools and material presented herein are not directed, intended for distribution to or use by, any person or entity in such jurisdictions or countries. All persons and entities accessing this function do so are on their own initiative and are responsible for compliance with applicable local laws and regulations.
4.4 The contents contained in Advanced Function are prepared and published by Futu Securities and have not been reviewed by the Securities and Futures Commission in Hong Kong. Data sources are from financial statements or public information issued by listed companies from time to time. Futu Securities only processes and integrates such data, using specific algorithms to interpret it graphically and literally. The copyright and possibly other intellectual property incidental to such algorithms and program are belong to Futu Securities. Any media, websites or individuals shall not reproduce, link, repost, distribution, dissemination or use in any other ways without our prior written consent. Futu Securities reserves all rights. For any media, websites with authorization should mark "Source: Futu Securities」 when downloading the contents from our website/application.
4.5 Pattern interpretation and trend prediction are generated through specific comparison and identification by our algorithm model. It does not involve any personal ideas, design or revision of thresholds, or any other investment advice. Futu Securities does not guarantee or promise any algorithm results. In addition, past performance does not indicate future performance. There is no guarantee that a strategy based on historical information will produce the desired pre-defined investment objectives, strategies and/or themes (as applicable) or results in the future, and if market dynamics change, the accuracy and effectiveness of the algorithm strategy may be limited.
4.6 Information contained herein is based on sources that Futu Securities believed to be accurate and reliable. However, this function is not intended to contain all the information that investors need, and may be influenced by system interruptions or malfunctions, data transmission delays, computer virus or circuit and system failure. Since the result of this function is generated by established algorithm and program, there are considerable limitations and risks. We do not declare or warrant (either express or implied) that such information and data contained in this function is adequate, accurate, complete reliable and fair. In no event will Futu Securities be liable for any special, indirect, incidental or consequential damages which may be incurred from the use of the information in this function.
4.7 Material contained in Advanced Functions is provided for information purpose only. Such financial analysis, pattern interpretation or algorithm result does not take into account your investment background or risk profile. It is not and should not be construed as an offer to sell or the solicitation of an offer to buy any security, or any advice or recommendation to enter into any transactions in respect of the products referred. To the extent that this material presents relevant graphs, discussion of general market activity, industry or sector trends or other broad-based economic or political conditions is for reference only. It is neither an indication, prediction, forecast nor guarantee of future performance results or the quality of an investment, and is subject to change without notice. Futu Securities does not endorse or recommend any investment, trades or trading strategies discussed herein. You should seek professional advice from a financial adviser (if necessary), take into account your own specific situation and risk tolerance level before making a commitment to invest in any of such products based on the information provided by this function.
4.8 All terms and conditions of this Disclaimer are governed by Hong Kong law and should be interpreted in accordance with the laws of Hong Kong.