U.S. stock order book
1. Overview
a) BBO Order Book: Displays the best bid and offer (BBO) quotes as well as their respective volume ratios.
b) Order Book: Displays the detailed order book of an exchange; Supports depth chart, exchange switching, and price aggregation.
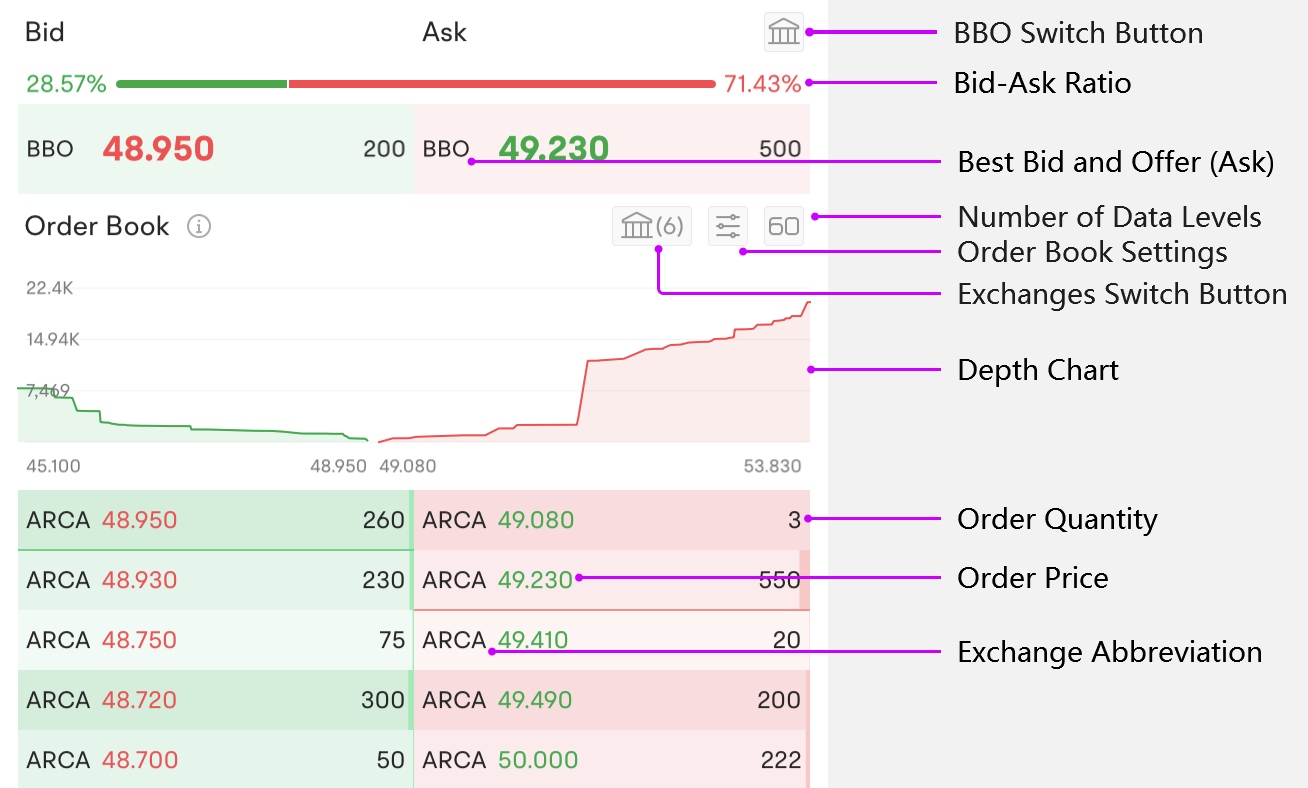
2. BBO
BBO is short for "best bid and offer". Two types of BBOs should be distinguished: NSDQ BBO and National BBO. You can switch by tapping the small 'house' button on this page.

Comparision of NSDQ BBO & National BBO:
|
NSDQ BBO |
National BBO |
|
|
Description |
Nasdaq's best quotes |
The best quotes among 16 US exchanges |
|
Data Source |
Nasdaq Basic |
National LV1 |
|
Refresh Rate |
Real time |
Real time |
|
Share Number Limit |
None |
At least 100 shares |
|
Charge |
Free |
Paid |
3. Order Book
3.1 Multiple Order Books
a) Introduction
Futu Indepth Order Book consists of data from multiple exchanges and you can select order books from different exchanges as you wish by tapping the small 'house' button.
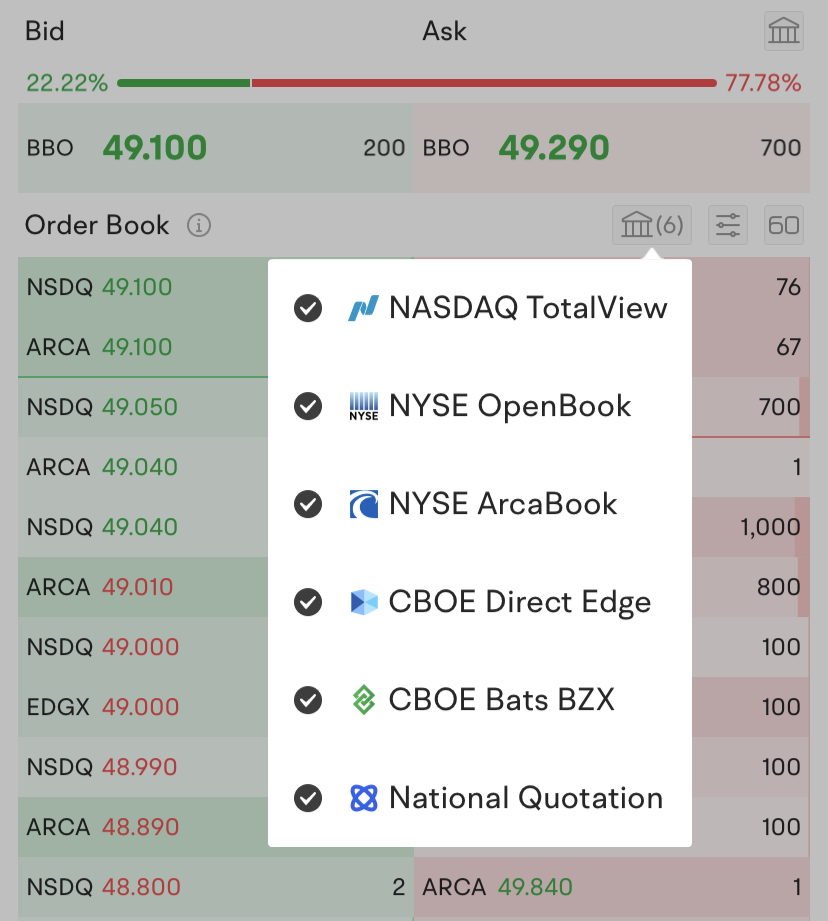
Comparison of order books of different quotes:
|
Order Book |
NYSE ArcaBook |
NYSE OpenBook |
NASDAQTotalView |
CBOE Direct Edge |
CBOE Bats BZX |
National Quotation |
|
Refresh Rate |
Real time |
Real time |
Real time |
Real time |
Real time |
Real time |
|
Number of data |
60 |
60 |
60 |
60 |
60 |
16 |
|
Charge |
Free during promotion |
Paid |
Paid |
Paid |
Paid |
Paid |
|
Supported Exchange |
Arca Exchange |
NYSE |
Nasdaq |
Direct Edge |
BATS |
BBO of 16 Mainstream Exchanges |
|
U.S. Transaction Volume |
About 10% |
About 12% |
About 18% |
About 7% |
About 5% |
-- |
|
Pre-Market and Post-MarketOrders |
Supported |
Pre-market orders will not be matched; Post-marketordersnot supported |
Supported |
Supported |
Supported |
-- |
|
New stock bidding to be matched |
Not supported |
NYSE-listed stocks supported |
Nasdaq-listed stocks supported |
Not supported |
Not supported |
-- |
NYSE OpenBook only supports aggregated data. There is no switch for aggregation.
3.2 Price Aggregation
a) Introduction
Orders with the same price may occupy several data levels. After Aggregating by price, traders can acquire more data levels and information
3.3 Depth Chart
a) Introduction
Order books can display orders at each price. However, it is very difficult for investors to quickly grasp the relative strength of buyers and sellers when dozens of orders are displayed. By means of data visualization, we present prices and order quantities in a chart to help investors better understand supply and demand.
b) How to read the chart?
X-Axis indicates the price distribution of all orders
Y-Axis indicates the cumulative order numbers up to or down to a certain price (i.e., the number of orders currently needed to be filled for the stock to reach a certain price level)
Press on the depth chart area and a crosshair will show, which will show the price and cumulative order number of a certain point.
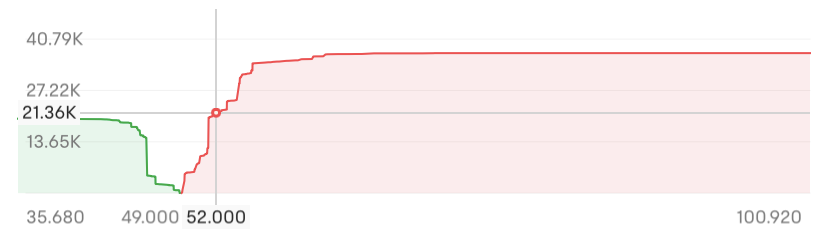
c) Function
Chart height represents the cumulative order number;
Chart width represents the range of price distribution;
Where the line is steep, it indicates that orders are concentrated at certain price level
4. FAQs
4.1 What is the function of order books?
Order books provide comprehensive order information across different exchanges. The additional information better reflects market supply and demand and can assist traders with investment decisions.
A line will show to highlight orders priced between the best bid and ask. This function is helpful when you wish to buy only several shares of expensive stocks such as AMZN.

4.2 BBO Anomalies
BBO sometimes has an unusual situation where the price of best bid is equal to or higher than the best ask. Details are as follows:
Locked Markets: A situation where the bid and ask prices for a security are identical;
Crossed Markets: A situation where the bid price higher than the ask price;
These unusual circumstances arise as orders are submitted to different exchanges and thus they cannot be matched.
4.3 Listing Day Order Book
On the listing day of a US stock, there will be a period when no orders will be matched (on-site auction period). For stocks listed on NASDAQ, you can view online orders to be matched via NASDAQ TotalView; for stocks listed on the NYSE, you can view via NYSE OpenBook.
4.4 Why there is no data after market close?
The data of order books will be cleared after 0:00 EST and will not be retained.
4.5 Some NYSE OpenBook data appear to be abnormal?
There are two reasons:
a) Pre-market and post-market trading hours: The NYSE does not conduct pre-market matching. Therefore, all NYSE orders in the pre-market period will be displayed in NYSE OpenBook data, but no matchmaking will be performed, so there are many seemingly abnormal prices In the phenomenon, the buying price is substantially higher than the selling price.
b) Circuit breaker: Circuit breakers function automatically by stopping trading when prices hit predefined levels. When trading is suspended, the exchange will not match trades. Thus crossed or locked markets may rise.
4.6 About MPID (Market Participants ID)
NASDAQ TotalView, NYSE OpenBook, and NYSE ArcaBook are usually displayed as NSDQ, NYSE, and ARCA respectively, indicating that the orders come from participants in the specific exchange. There are sometimes some other market maker IDs.
4.7 Why does my unfilled order not appear on BBO?
There are two possibilities:
a) The current BBO is provided by another exchange
b) The current BBO is provided by the exchange where your order is received, but the amount of your order is not optimal (need at least 100 shares to appear on BBO)
Overview
- 1. Overview
- 2. BBO
- 3. Order Book
- 3.1 Multiple Order Books
- 3.2 Price Aggregation
- 3.3 Depth Chart
- 4. FAQs
- 4.1 What is the function of order books?
- 4.2 BBO Anomalies
- 4.3 Listing Day Order Book
- 4.4 Why there is no data after market close?
- 4.5 Some NYSE OpenBook data appear to be abnormal?
- 4.6 About MPID (Market Participants ID)
- 4.7 Why does my unfilled order not appear on BBO?