Company valuation
Before referring to this guide, please ensure that you are using Futubull App version v13.47.14108 or later.
Company valuation assesses a company’s intrinsic value, helping investors determine whether its market value is overvalued or undervalued and make better-informed investment decisions. To gain a comprehensive understanding of a company’s valuation data, you can use Futubull’s Company Valuation feature.
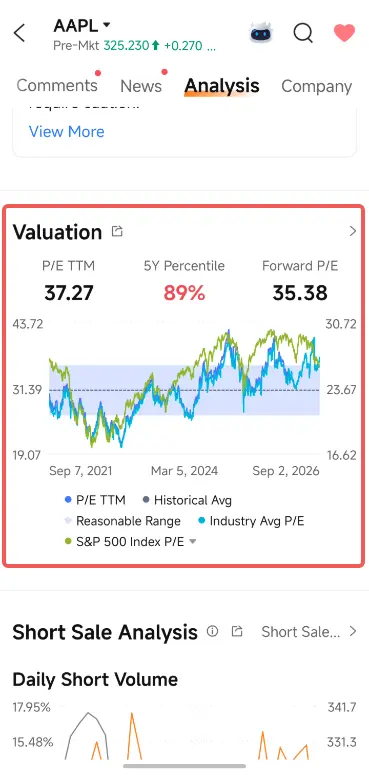
Path: Stock Quote Page > Analysis > Valuation. Tap the “>” icon in the upper-right corner to enter the details page.
The details page provides three valuation models: the price-to-earnings ratio, price-to-book ratio, and price-to-sales ratio. Their formulas are as follows:
-
P/E (TTM) = Share Price ÷ Earnings per Share
Earnings per share = Net profit attributable to shareholders of the parent company over the past 12 months ÷ Total number of shares -
P/B = Share Price ÷ Book Value per Share
Book value per share = Shareholders’ equity ÷ Total number of shares -
P/S = Share Price ÷ Revenue per Share
Revenue per share = The company’s total operating revenue over the past 12 months ÷ Total number of shares
The P/E page is used below as an example.
The page consists of three sections: Historical Distribution, Industry Distribution, and Market Distribution.
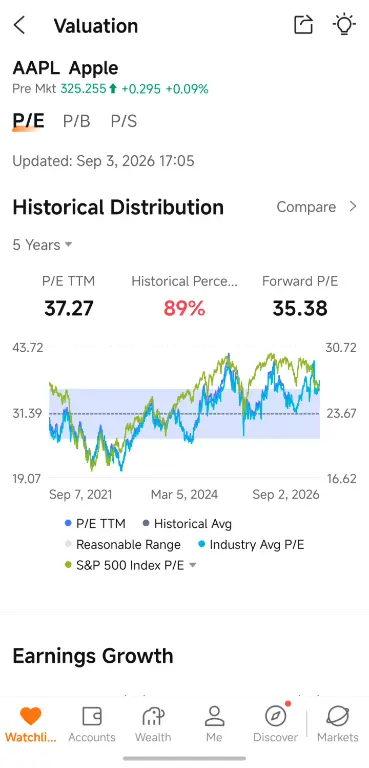
Historical Distribution
By default, the Historical Distribution chart displays the company’s current P/E ratio, industry average, historical average, and reasonable range over the past three months. Above the chart, you can also view the current P/E ratio, industry average, and the percentage of historical values that the current P/E ratio exceeds.
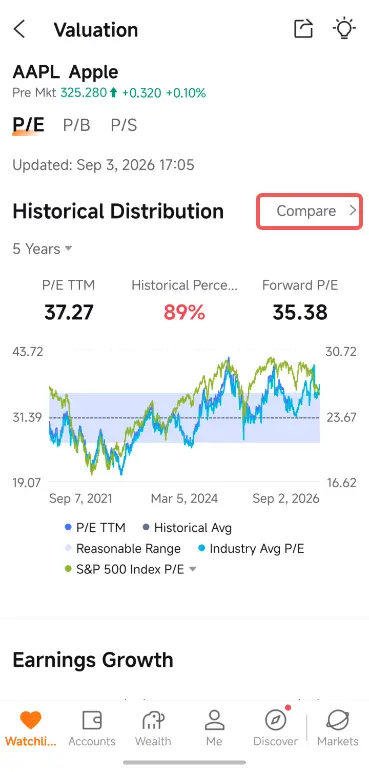
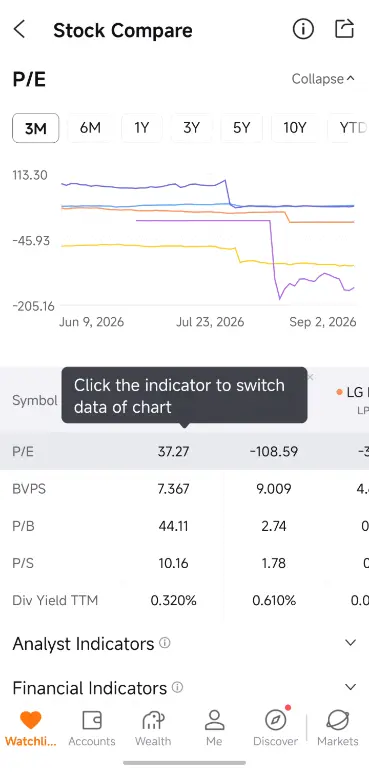
To compare the valuation metrics of different stocks in greater depth, tap Comparison on the right.
Industry Distribution
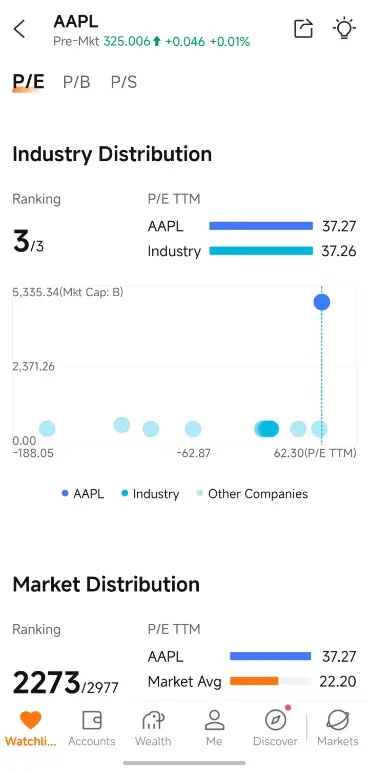
The Industry Distribution section first shows the stock’s ranking within its industry, along with its P/E ratio and the industry average.
In the visualization below, the vertical axis represents market capitalization, the horizontal axis represents the P/E ratio, and each circular marker represents a different company. Tap any marker to view the company’s name, P/E ratio, and market capitalization.
Market Distribution
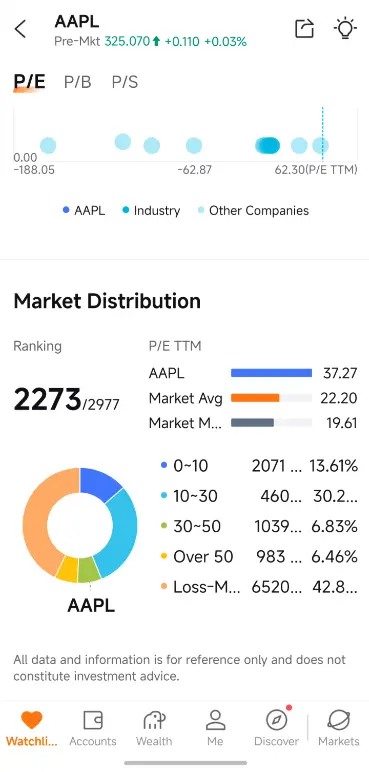
The Market Distribution section shows the stock’s ranking within its respective stock market and allows you to compare its P/E ratio with the market-wide average and median. The pie chart below provides a clearer view of the stock’s position within the overall market.
Valuation can be affected by many factors, including a company’s business model and profitability. In addition to valuation, investors should consider the combined impact of various factors and conduct a comprehensive analysis and assessment to make better-informed investment decisions.
Futubull is a one-stop financial investment and trading platform. Securities services are provided by Futu Securities International (Hong Kong) Limited. This content does not constitute, and should not be regarded as, an offer, solicitation, invitation, or recommendation to buy or sell any investment product or make any investment decision, nor should it be construed as professional advice.