How corporate actions are handled in a backtest
1. What is stock price adjustment?
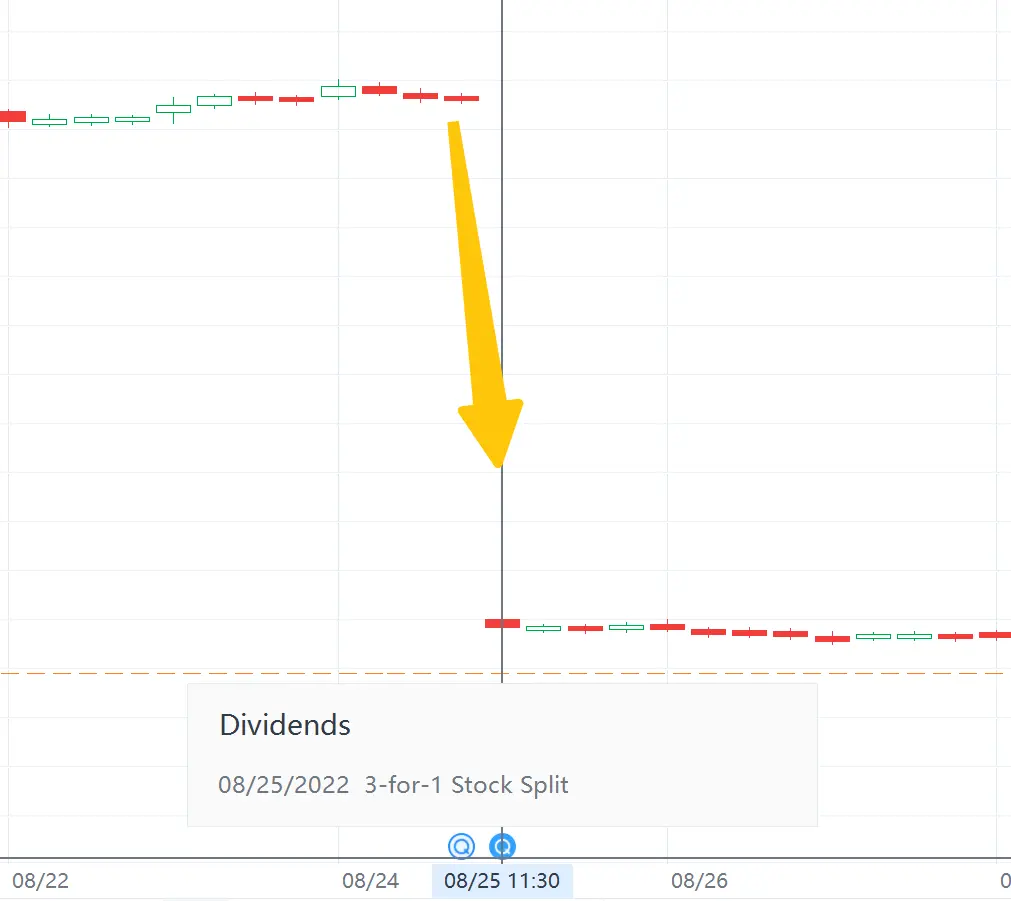
Listed companies may choose to issue dividends or additional shares. These corporate actions can impact stock prices and create gaps in the price chart. Therefore, it's necessary to use stock price adjustment to reconcile corporate actions that result in stock price changes.
Stock price adjustment involves adjusting historical stock prices and trading volume based on the latest dividend or stock split data. The purpose is to ensure continuity between historical and recent prices, avoiding gaps caused by corporate actions.
2. Stock price adjustment in a backtest
There are two types of stock price adjustments: forward adjustment and backward adjustment.
Pre-event prices can be adjusted based on the price on the first day following the event, or post-event prices can be adjusted using the price from the last day before the event. Algo's backtesting will adjust the pre-event prices. Here is how stock price adjustment is used in the app.
2.1 Backward price adjustment
After a stock goes ex-dividend, historical stock prices need to be proportionally reduced to maintain continuity. During the backtesting period, Futubull will automatically adjust pre-ex dividend prices backward and handle cash and holdings in the account whenever a corporate action occurs. Taking a stock split as an example, the figures below show the price change without adjustment, as well as the backward adjusted price.


3. Summary
Stock price adjustment can help investors better understand the stock price trend. Algo's backtesting has a price adjustment function, which can help users simulate actual investment performance. For more information, please refer to the following examples below.
|
Corporate Action |
Stock Price Change |
Holdings Change |
Example Before Corporate Action |
Example After Corporate Action
|
|
Cash Dividend
|
|
|
|
Cash dividend: $1 paid for every 10 shares held New stock price: $19.9/share Adjusted historical prices: All past prices decrease by $0.1 Total shares held: 100 Total market value of holdings: $1,990 Account cash increase: $10 |
|
Stock Split
|
|
|
|
Stock split: 1 share split into 2 shares New stock price: $10/share Adjusted historical prices: All past prices divided by 2 Total shares held: 200 shares Total market value of holdings: $2,000 |
|
Reverse Stock Split |
|
|
|
Reverse stock split: Every 2 shares are merged into 1 share New stock price: $40/share Adjusted historical prices: All past prices doubled Total shares held: 50 shares Total market value of holdings: $2,000 |
|
Capitalisation Issue |
|
|
|
Capitalisation issue: For every 10 shares held, an additional 10 shares are given New stock price: $10/share Adjusted historical prices: All past prices halved Total shares held: 200 shares Total market value of holdings: $2,000 |
|
Bonus Issue |
|
|
|
Bonus issue: 10 new shares given for every 10 shares held New stock price: $10 per share Adjusted historical prices: All past prices are halved Total shares held: 200 shares Total market value of holdings: $2,000 |
|
Rights Issue |
|
|
|
Rights issue: 1 additional share at $15 for every 4 shares held New stock price: (1 share at $15 + 4 shares at $20) / 5 shares = $19 per share Adjusted historical prices: Original price × 0.8 + $3 Total shares held: 100 shares Total market value of holdings: $19 * 100 shares = $1,900 Account cash increases by $100 |
|
Additional Shares |
|
|
|
Additional shares: For every 4 shares held, 1 additional share could be purchased at $15/share New stock price: (1 share at $15 + 4 shares at $20) / 5 shares = $19 per share Adjusted historical price = Original Price × 0.8 + $3 Total shares held: 100 shares Total market value of holdings: $19 * 100 shares = $1,900 Account cash increases by $100 |
|
Separation |
|
|
|
Separation: 1 share of another company is given for every 10 shares held New shares are worth $5 each Total shares held: 100 shares Total market value of holdings: $1,950 Account cash increases by $50 |
This presentation is for informational and educational use only and is not a recommendation or endorsement of any particular investment or investment strategy. Investment information provided in this content is general in nature, strictly for illustrative purposes, and may not be appropriate for all investors. It is provided without respect to individual investors’ financial sophistication, financial situation, investment objectives, investing time horizon, or risk tolerance. You should consider the appropriateness of this information having regard to your relevant personal circumstances before making any investment decisions. Past investment performance does not indicate or guarantee future success. Returns will vary, and all investments carry risks, including loss of principal. Our platform makes no representation or warranty as to its adequacy, completeness, accuracy or timeliness for any particular purpose of the above content.
Overview
- No more -